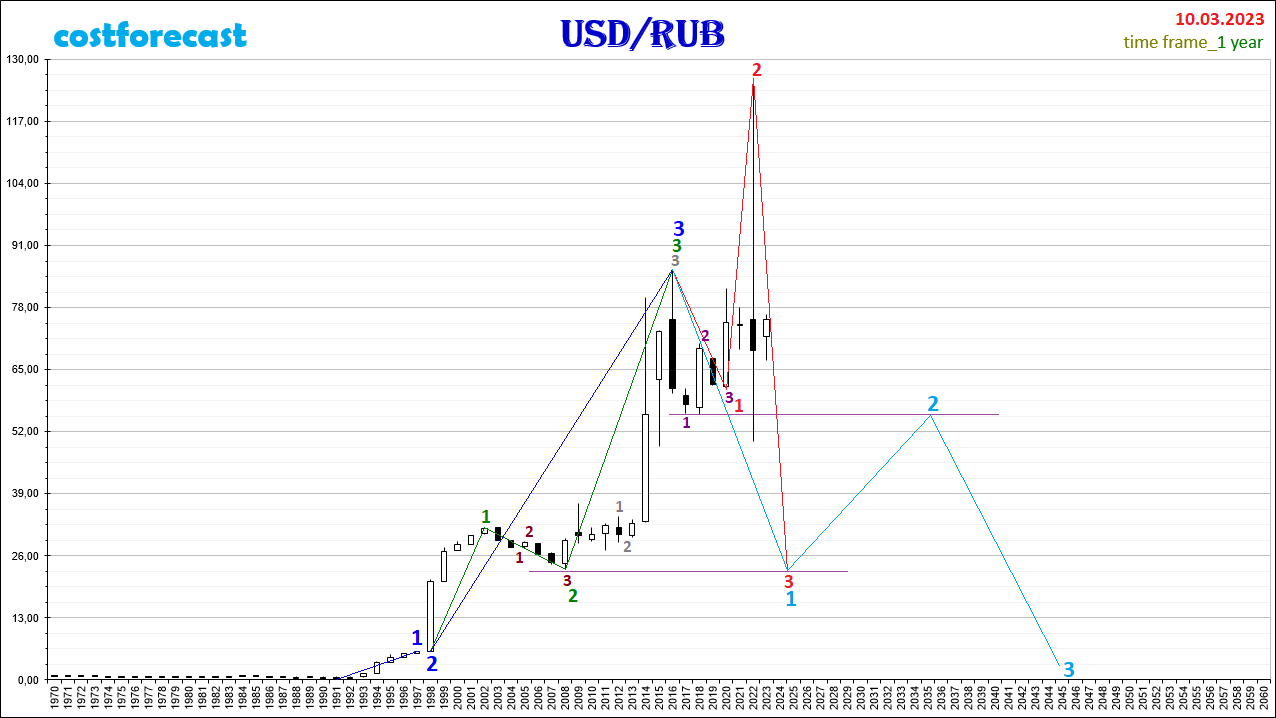
The fractal structure of the chart with a time frame of 1 year.
You can see the forecast of the dynamics of the ruble quotes made a year ago here.

As of 03/10/2023, it can be assumed that in the fractal structure of the USD/RUB currency pair quotes dynamics chart over the time interval (2020; 2022) at the point with coordinates (03/10/2022; 126.00), the 2nd segment of the fractal, which is marked in red, and that the subsequent fall in quotes takes place within the framework of the formation of the 3rd segment of this red fractal.
The fractal marked in red is the F14 fractal, i.e. View 1 and Type 4 (see Alphabet of Niro Attractors). The 1st segment of the red fractal is the F33 fractal (3rd view, 3rd type), the segments of which are indicated on the chart by purple numbers and has a time interval (2016, 2020). In this case, the current dynamics of USD/RUB quotes will be downward as part of the formation of the 3rd segment of the red fractal in the time interval (2022, 2025).
The assumption that a fractal is formed in the fractal structure of the USD/RUB chart, which is marked in red on the chart, is based on the fact that the F11 fractal (view 1, type 1) formed in the time interval (1991.2016), which is marked in blue .
The 1st segment of the fractal, marked in blue, was formed on the time interval (1991,1997). The time interval of the 2nd segment of the blue fractal is the interval (1997, 1998). The 3rd segment of the blue fractal was formed on the time interval (1998, 2016).
The blue fractal ended in 2016 with its 3rd segment formed on the time interval (1998, 2016), which is indicated on the chart by the green fractal F11 (view 1, type 1).
The 2nd segment of the green fractal is the F21 fractal (view 2, type 1), whose segments are indicated on the chart by dark brown numbers within the time interval (2002, 2008). The 3rd segment of the green fractal was formed on the time interval (2008, 2016) as the F11 fractal (view 1, type 1), the segments of which are marked with gray numbers.
Taking into account the above, the current dynamics of the quotes of the USD/RUB currency pair will be downward towards the mark of 23 rubles per dollar by 2025 as part of the completion of the formation of the red fractal, which is the 1st segment of the fractal of a larger order, which is indicated in the chart in blue.
After 2025, the dynamics of quotations of the USD/RUB currency pair will be upward until 2035 as part of the formation of the 2nd segment of the blue fractal in the direction of 55 rubles per dollar.

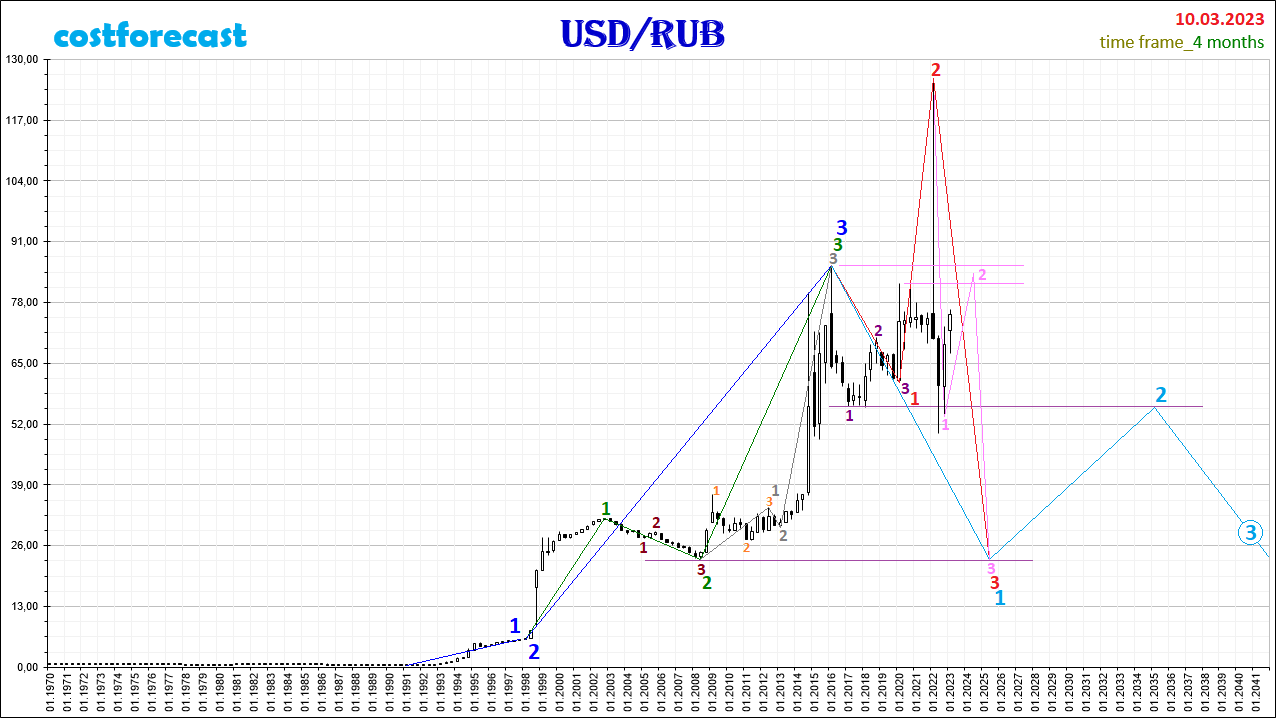
Analyzing the fractal structure on the graph of the dynamics of the ruble quotes, built with a time frame of 4 months, we can assume that the downward dynamics will most likely take place within the formation of a fractal, which is indicated in pink. Taking into account this assumption, at the point with coordinates (09/30/2022; 53.64), the 1st segment of the pink fractal was completed and its 2nd segment began to form, suggesting an increase in quotes to the mark located in the range (81.98; 85, 99), after which the downward dynamics will continue as part of the formation of the 3rd segment of the pink fractal in the direction of 23.00.
You can get acquainted with the method of modeling the dynamics of value in the financial market here, and with the technique of reading charts - in the article “To know what to buy, what to sell, you need to read charts.”


