
How REAL backtesting is done in the finance industry and why YOU are doing it wrong!
This is an absolute must-read for any serious trader before venturing to use any EA. You DON’T have to actually do the below mentioned calculations, but make sure to understand the underlying concepts because that way you know what should be included in every backtesting report, how to properly read them and what red flags to look out for. I see many traders buying expensive EAs based on the limited and marginal capabilities of Metatrader’s backtesting tool, but in order to be a successful trader you need to step up your game and use the same evaluation methods that professional traders in the banking and hedge fund industry do.
Let’s start with what in my opinion is the most important factor to consider before even looking at any other metric:
1. In-Sample/Out-Of-Sample testing
It is important to get this one right, because here is where most of the traders delude themselves. In-Sample data exists in two forms: artificial ticks created by Metatrader based on hypothetical price action, and historical data provided to you by your broker. This In-Sample approach assumes that the markets are totally deterministic and is naively used to fit your model. But in reality this won’t work in the long run. This issue becomes even more complicated by the fact that historical data varies from broker to broker because the amount of liquidity to which they have access to differs, which in turn affects the overall price action and can therefore give you wildly different test results. To make matters even more complicated, most non-prime brokerages don’t have access to pre-2017 ticks and therefore provide you with artificial ticks. The in-house backtester of MT unfortunately doesn’t account for any of those factors, which is often the reason why so many traders lose capital in the long run even though the backtesting results of MT looked promising, or they miss out on a potentially profitable EA simply because the backtester gave a seemingly bad result.
Be especially wary when you see graphs like this from MT backtesting:

Such near-straight balance lines are very deceptive because the input parameters of an EA can be intentionally programmed to put out such a result, but as soon as the EA is run for a good while in the real market environment you’ll have a bad awakening. A dishonest programmer could very easily create an EA with such fantastic outputs, simply by extracting the ticks from the csv files, organize them in several „price action categories“, calculating the median values of those categories and code his EA in such a way that it executes and closes out trades based on those outputs. Such perfect balance lines with no variance are literally impossible to achieve in the actual markets because this assumes that the pattern of the CURRENT market remains identical to future patterns and thus the input never has to change. Another way to manipulate the backtesting result is to code the bot in such a way that it simply ignores most losses when the trader backtests the EA.
Think about it this way: where have you ever seen live balance lines such as these in any trader’s portfolio, be they retail or institutional? In all the years that I have been working in the investment banking and hedge fund industry, I haven’t seen a single instance where any trader, no matter how professional and insightful, has been able to provide such results to his client base or himself. I challenge you to find me just one live portfolio with such a perfect line and I’ll promise you to put all my funds into it and call it a day. This is eye candy, but has nothing to do with reality.
Real-world balance/equity lines look more like this:

As you can see in the example above, the invested capital experiences some ups and downs, but is overall increasing. It looks much more organic and natural, and is much closer to actual trading performances of institutional funds. Why is that, you ask? Well, this happens because even the strategy that (professional) traders use, must adapt to changing market conditions no matter how reliable the strategy is (and it takes time to adapt), but until then the balance line might experience some hickups.
You’re probably wondering at this point what the actual use of the MT backtester is, if the results can be manipulated so easily?
To answer this question in the most simple manner: the ticks of Metatrader and all of the non-prime brokers that you use, provide you with In-Sample datasets in order for you to 1) test if the EA shows any potential bugs in trade execution or has some incompatibility with the program itself (check error logs) and 2) test if the EA actually executes trades based on the indicator inputs and overall strategy of the EA (turn on visual mode). In that respect it is actually a useful tool that MetaQuotes provides and that’s where the strength of it shines.
But if you want to test the actual profitability of the EA you can’t get around Out-Of-Sample testing (OOS). When I worked in the trading department of an investment bank, my supervising managers never approved of a new and upcoming trading bot until they have seen OOS test results, and for good reason: huge sums of client funds were and still are at stake. If you want to be like smart money then you should think and act like they do.
This leads us to the question of how OOS actually works and what makes it so much more reliable in backtesting. As you have already learned, In-Sample refers to deterministic artificial/historical data that you already have, but the problem with relying on it is that past performance does not, in any shape or form, indicate future performance, especially when it’s artificial data. So, how do we mathematically solve this problem? Simple, by using randomized computational statistics. The same way the markets are based on future price uncertainty, while relying on a set of repeating patterns, we implement that uncertainty into the backtesting procedure, by taking a portion of the data of those past patterns and let it run through an algorithm that randomizes those samples in order to obtain results that are much closer to actual reality than In-Sample datasets. The EA then executes trades based on that randomized sample where you can see how it would actually perform in the markets. Backtesting thus becomes a much more accurate representation of the live performance of the EA in question.
In my opinion every financially judicious person who takes trading as a serious profession should first look at OOS results before passing a final judgement of the supposed profitability of the EA itself.
2. Monte Carlo Simulation (MCS)
MCS directly ties in with OOS. It was invented by John von Neumann and Stanislaw Ulam during World War II to improve decision making under uncertain conditions. It was named after a well-known casino town, called Monaco, since the element of chance is core to the modeling approach, similar to a game of roulette. It is widely used today by many casinos to improve their winning chances against the players.
MCS applies the results of an OOS test in a graph, where each increment of randomization is expressed as „confidence“ in percentage (where 100% confidence reflects a market that deviates the most with your strategy). Each confidence level is visualized by a different colored line. The wider the gap between each of those lines, the worse the proposed system will perform in real-world conditions.
The example above shows a MCS with results that could be considered catastrophic. The uppermost lines are increasing and a normal backtest without MCS would therefore show you a test result that gives you a false sense of security, but as soon as you run the trade through the MCS you’ll see visually what would happen if the markets deviate from your strategy in a more or less drastic way (indicated by the confidence levels as I will show below). In our example above, a confidence of approximately 50% will give us flat results (no significant profit) and anything above that will actually eat away your invested capital and eventually blow up your account!
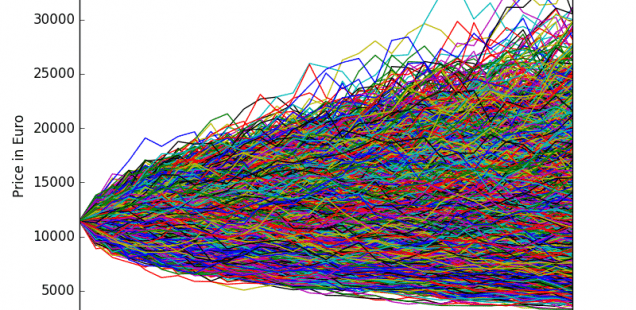
This is how a good Monte Carlo Simulation is supposed to look like:


The confidence level „Original“ stands for 0%, and as you can see, even a confidence of 100% still gives you very profitable results. The difference in total net profit is only 12.61% in a market environment marked by complete unpredictability, which proves the robustness of the EA. That’s how a solid, institutional-grade system is supposed to look like.
3. System Quality Number
Before understanding SQN you need to make sure that you grasp the underlying principles of it that drive the resulting ratio. In other words you need to understand R-expectancy and R-multiples.
The R stands for your initial trade risk and all your profits and losses should relate to it. For instance, if you decide to risk $100, but end up losing $200, your trade’s R-multiple is -2R. If you risk the same amount but instead rake in a nice $500 profit, your R-multiple is +5R. Ideally, your losses should be no more than -1R. If you trade an illiquid market, slippage can often make you lose more than expected.
With the R-multiple of each trade calculated, you can then calculate your system’s R-expectancy. This is the average R-multiple across all the trades in your backtest. Below is a hypothetical system with 5 trades to compute the R-expectancy:

And now you’re ready to calculate the actual SQN:

This will give you the ratio between the R-expectancy and its standard deviation, multiplied by the square root of the number of trades. The expectancy measures your system’s profitability, while the standard deviation measures consistency.
If your individual R-multiples are closely clustered around the expectancy, your standard deviation will be low, improving your SQN. Similarly, a large backtest sample size improves the statistical significance of your metrics, giving a higher SQN. Dr. Tharp provides the following benchmarks, based on a sample size of 100 trades:

There is something to note here: although Dr. Tharp classifies anything above 7.00 as a holy grail system, this is only true in a potential sense. It is critical to take other metrics into consideration before finally judging the system, such as Return/Drawdown, Sharpe Ratio, Position profit by position holding time, etc.
4. Position Profit By Position Holding Time
This one is not an absolute must-know to evaluate the profitability of an EA, but it nonetheless gives you unique insight into when the most profits are realized.

As can be seen from the above screenshot, the most profitable trades with this specific EA happen with a Position Holding Time of no more than 60 minutes. As time passes by, the amount and frequency of profitable trades decreases while the potential losses increase, with most losses occuring during a holding time of 300 minutes or 5 hours. My EA "APEX 9®" for example has this as part of its trading profile before entering a trade and therefore holds its position for an average of 1.5h to cut losses short. Any future EA that I’m going to publish will have this feature as part of its trading profile to reduce the risk as much as possible while maximizing the potential return. It has always proven to be useful to see this type of information before using an EA, because it gives you a more complete and transparent picture of the EA’s profitability and risk.
I hope you found my blog post informative and helpful. Please leave a comment and let me know whether anything needs clarification. Any contribution is welcome too! Happy trading!


")