

Greetings fellow traders!
In this article, I will try to cover the topic of using the iPump indicator in trading.
The main aspects that we will consider:
1) Using an oscillator
1.1 What values of the overbought / oversold index are important and how to determine them visually on the chart
1.2 How to set an overbought/oversold alert
2) Resistance and support levels
2.1 Classification of levels
2.2 What levels do I use in trading, my experience
3) Trend panel
3.1 What TFs follow the trend indicator
3.2 Which time frame is more significant for me to determine the trend
I
Using the oscillator
1.1 What values of the overbought / oversold index are important and how to determine them visually on the chart
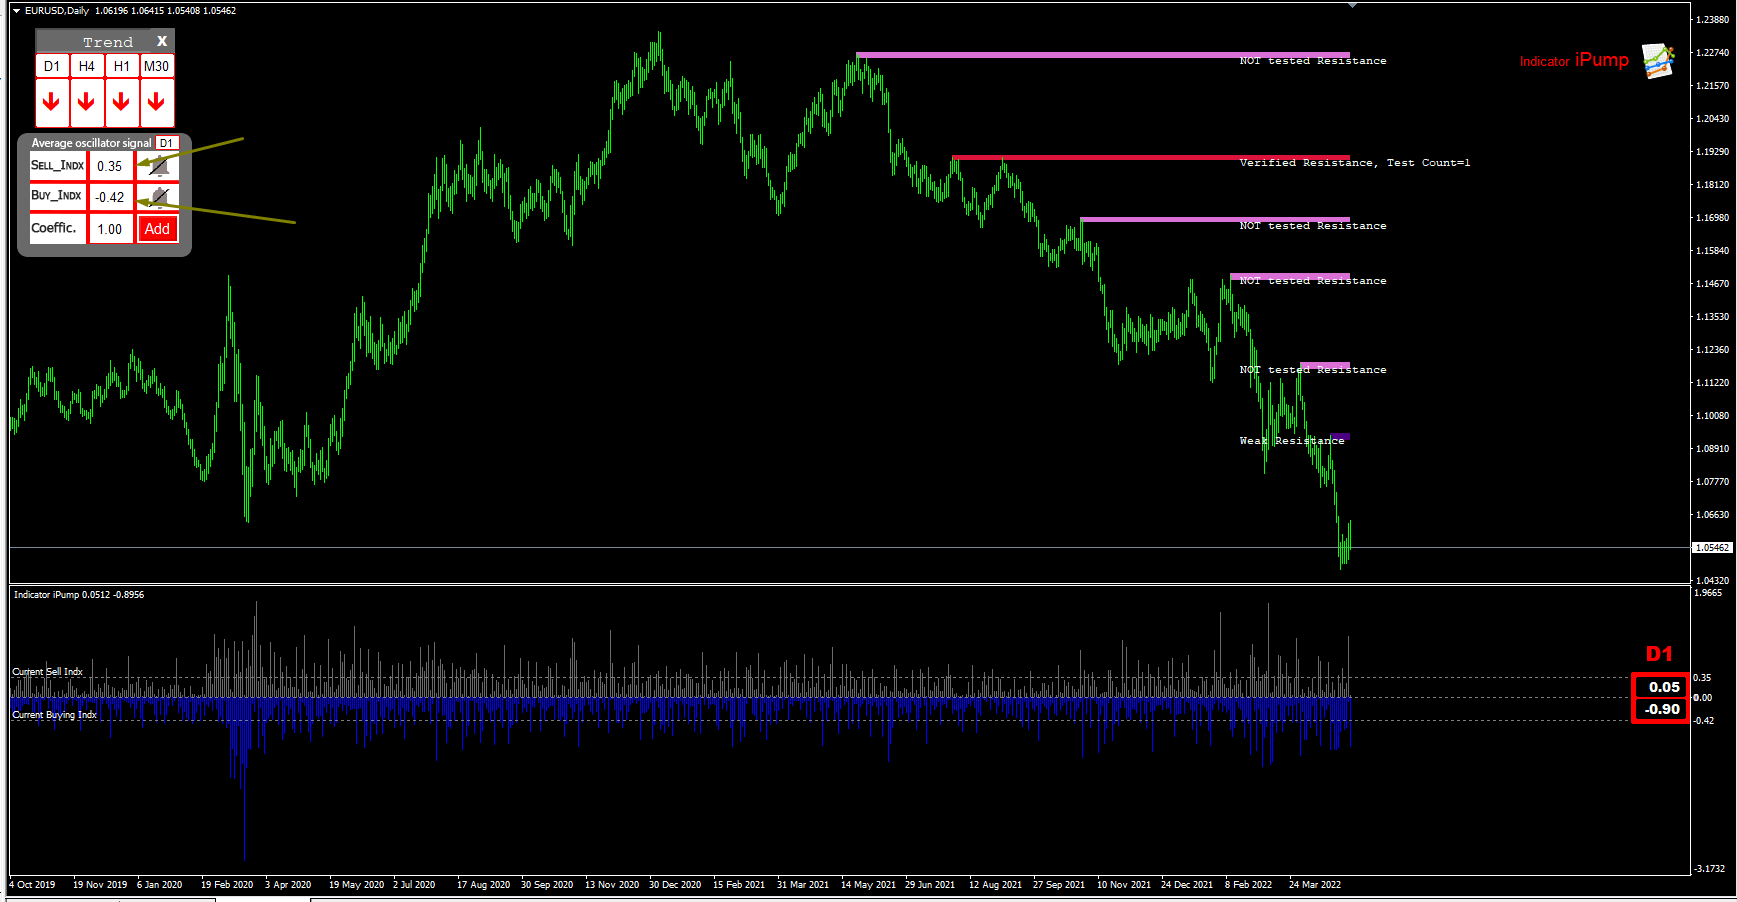
The higher the oscillator index, the better. A high index indicates a strong signal. We take 0 as the basis for Overbought, a zero value indicates that the asset has the lowest overbought level, respectively, the higher the index, the more the asset is overbought.
With oversold, everything is the same, only the more negative the value, the better. We take 0 as the basis, 0 indicates that the asset has the lowest oversold level, the further the negative value, the stronger the signal.
What is the meaning of the indicator - for example, you are trading EUR / USD and as you can know, the pair is mainly traded in a certain range most of the time, that is, it will either fall or rise, with the indicator you can analyze the instrument that most of the time within daily time frame, EUR/USD falls 0.41% and then rises, and the pair also rises by 0.35% and then falls. Knowing these values, you can understand when you should try to sell an asset, and when to buy.
Important! The strategy is to work like this:
- for a downtrend ↓, we are looking for assets with a high overbought index and sell, following the trend.
- for an uptrend ↑ we look for assets with a high level of oversold and make purchases with the trend.
Average value of the oscillator
To do this, point the Crosshair tool at the oscillator itself and in the place where the tails of the bars will be the most and will be the average value. Accordingly, all values above the average will be of most interest to us.
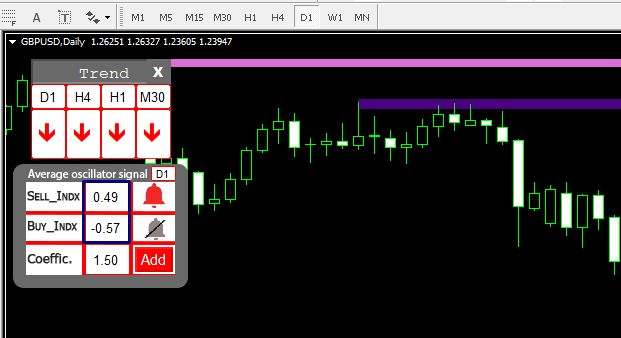
For the convenience of understanding how much the current instrument is oversold or overbought, a panel has been added to the indicator showing the average values of the oscillator for the selected period.
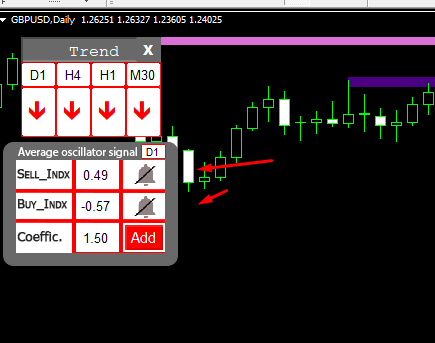
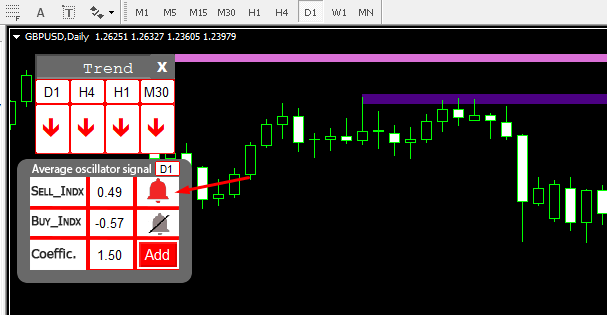
The panel calculates indicators for each TF. By clicking on the bell, you will receive a notification when the current value becomes more than the average, taking into account the set coefficient.
The Coefficient field is used to multiply the average by the coefficient, for example, the average overbought value for EURUSD for the daily TF is 0.27 (growth / fall by 0.27% ), if we use a coefficient of 1.5, for example, then we are 0.27 * 1.5 = 0 ,41, that is, a coefficient that will be 1.5 times higher than the average value, respectively, this will be the most favorable signal for selling, of course, you must also take into account the trend and levels.
The most optimal coefficients are 1.5 and 2.
Average value data is also displayed in the oscillator window, lines are drawn automatically.

II
Resistance and support levels
2.1 Classification of levels
1. verified level – the level at which support/resistance has already been confirmed.
2. Turning level - a reversal level within which a price reversal can occur.
3. weak level - weekly level
4. not tested level - not a tested level, which means that this level has not yet been confirmed its significance as a price barrier.
2.2 What levels do I use in trading, my experience
The most significant levels for me, at which confirmation took place, verified level . Regarding the time frame, the most relevant levels for me are H 1, H 4, D 1.
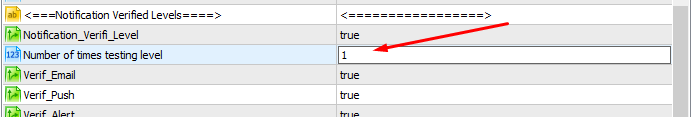
In the indicator, you can set up a separate notification for verified levels by the number of retests. You can set the retest values yourself 1/2/3 and so on. Further.
III
Trend panel
3.1 What TFs follow the trend indicator
With the help of the trend panel, you can view the trend on any TF, the letter L - shows the trend on the local time frame, which is not initially included.
In basic mode, you always see the direction of the trend on timeframes, D 1, H 4, H 1, M 30.

Rice. 6 iPump Trending
If you want to see the trend, for example, on M 5 or MN , just go to the desired TF and the direction of the trend will be displayed in the last cell of the trend panel .
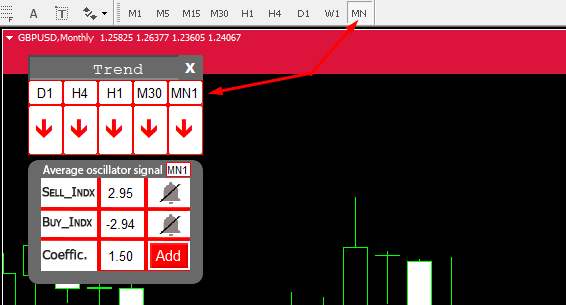
Rice. 7 Determining the local iPump trend
3.2 Which time frame is more significant for me to determine the trend
From my trading experience, I can say that the most significant time frames from my point of view are D 1 / H 4.
The most favorable situation occurs when we see a unidirectional trend on most timeframes.
Used automatic translation using Google translate original article in russian language ( there may be inaccuracies in the translation, if you write in the comments, I will correct it)
I ask you to express all incomprehensibility in the comments, then this article will be more understandable and extensive.


