Greetings traders,
Happy New Year.

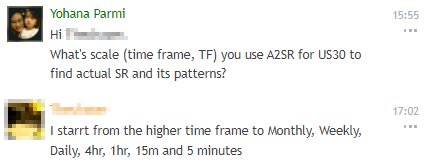
I wrote this blog because a valued member asked me how to deal with US30.
- with my respect then I provide it today.
It is assumed that someone has understanding to "what and how" of all about US30.
I'm sure this post is able to be useful for others.
 |  |
 | |
 |
- US30.
The US30 otherwise known as the DJ30 or just Dow is a price-weighted stock market index
- that measures the performance of the 30 largest publicly owned companies listed on the New York Stock Exchange.
Unlike most global indices that are a weighted average of the market capitalizations, the Wall Street 30 is a price-weighted average.
It was founded by Wall Street Journal editor Charles Dow and was first calculated on May 26, 1896, making it one of the oldest stock indexes.
US30’s primary objective is to indicate the U.S. economy’s general health and the direction of trends.
Given that its component firms are some of the world’s largest companies,
- the index gives an insight into the strength of the global economy.
Wall Street 30 index has remained one of the world’s oldest and leading benchmarks with high liquidity.
Its constituent companies are household names across different sectors in the global economy,
and so on.
- One of the reasons people like to trade US30 is because of its high volatility.
Several other groups of traders think that trading US30 is quite easy
by monitoring the movement (economic strengthening or decline) of the economy:
In general they are investors: "position traders".
A position trader is a type of trader who holds a position in an asset for a long period of time.
The holding period may vary from several weeks to years.
- The capital prepared by such investors is generally large.
Example:
During economic slowdown and recession times, companies start to report lower profits and
- lower business growth prospects.
It is due to this reason that investors start to sell stocks of companies reporting lower profits and
therefore the stock indices tracking these particular stocks will also start to move downwards,
and vice-versa. - How to trade US30.
> More details will be provided in the next paragraph/pages.
This is if you are not a "position trader".
- Examine the volatility. For sure, you need to examine the volatility of the US30 before you want to trade US30.
- The best potential that can be expected is when US30 ends the ranging session which is followed by strong breakouts.
- breakout = upward direction.
- breakdown = downward direction. - Know in advance, how far the volatility ranges.
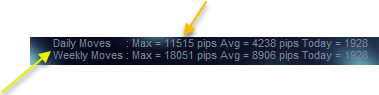
If you can't figure out a range of volatility ranges, at least today and this week,
- then you will definitely fail.
Because you will not be able to determine the correct lot size according to your balance.
Note.
The use of maximum lot size should only use 20% of the balance in this week's volatility range.
Even though at first traders get a lot of profit, but the use of lot sizes that do not match the balance will definitely make traders fail in a short time in the future.
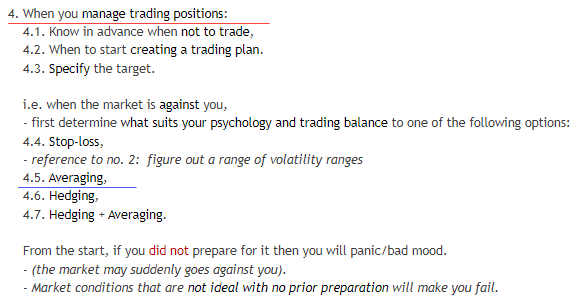
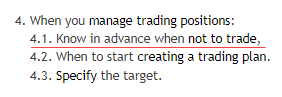
(!) The Volatility range is not only taken from the high-low of the weekly/monthly candlestick. - When you manage trading positions:
4.1. Know in advance when not to trade,
4.2. When to start creating a trading plan.
4.3. Specify the target.
i.e. when the market is against you,
- first determine what suits your psychology and trading balance to one of the following options:
4.4. Stop-loss,
- reference to no. 2: figure out a range of volatility ranges
4.5. Averaging,
4.6. Hedging,
4.7. Hedging + Averaging.
From the start, if you did not prepare for it then you will panic/bad mood.
- (the market may suddenly goes against you).
- Market conditions that are not ideal with no prior preparation will make you fail. - US30 > High volatility > Trading hours is best in US Session (NY Session)
- Create trading plans in the previous session, - before NY opens.
> Scalpers are usually enter the market on low volatile in London Session (European Session). - Know what are the technical instruments needed by traders.
Use a leading technical indicator is recommended.
One of many other examples is a doctor. A professional and very smart doctor definitely still needs technical/medical equipment.
Pilots also need complete control instruments on their planes, Special Forces also need sophisticated weaponry,
and so on - including traders also need it.
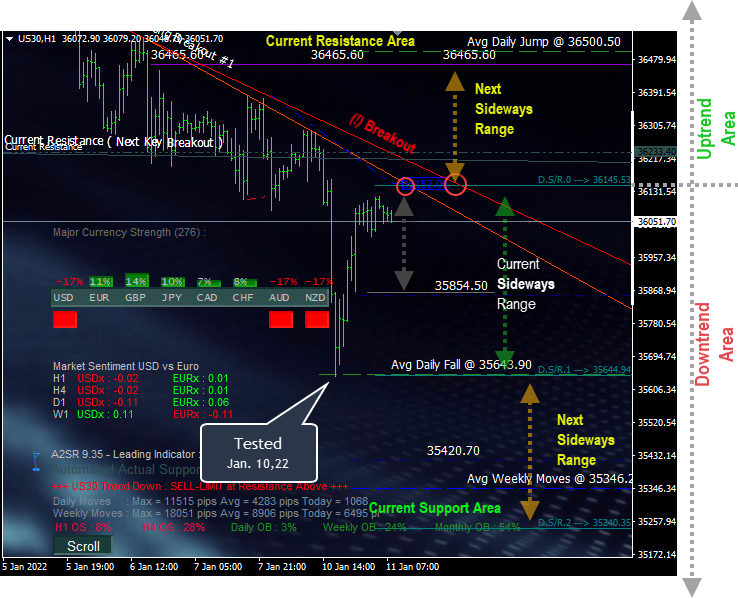
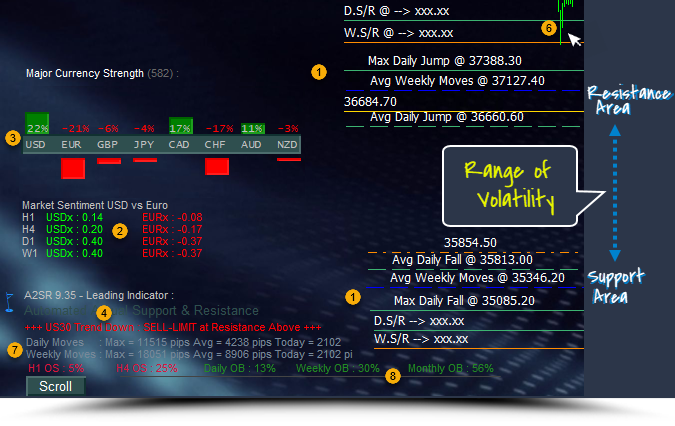
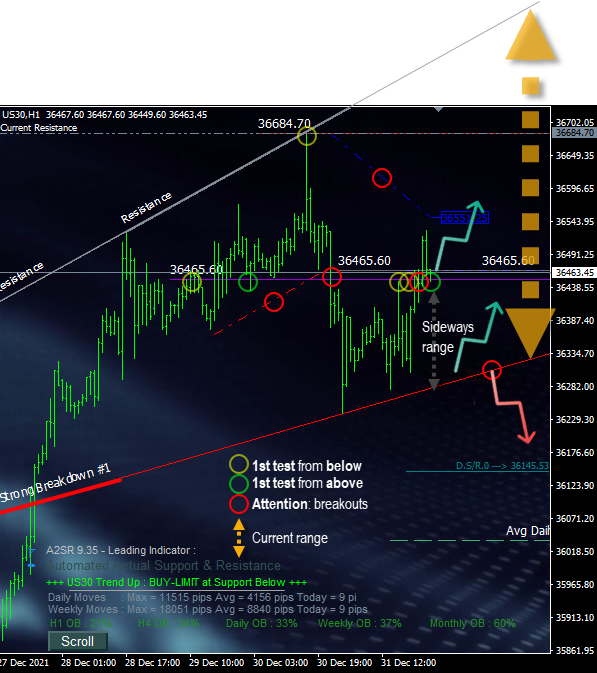
6.1. Actual Support & Resistance (A.SR) levels,
- (Color is ignored, just look at the position and the price label).
6.2. Market Sentiment (MS),
6.3. Major Currency Strength (MCS),
6.4. Trend (major/minor trend, trending market or ranging/sideways),
6.5. Chart Patterns (including which is strong breakouts line),
- Reference at :
- https://www.mql5.com/en/blogs/post/726752
- https://www.mql5.com/en/blogs/post/721843#comment_9084235
- https://www.mql5.com/en/blogs/post/723155
6.6. Price action (it is if you're a short-term trader: position at the 1st test price hits A.SR levels, MS and MCS on news event),
6.7. Range of Volatility,
6.8. Oscillators.
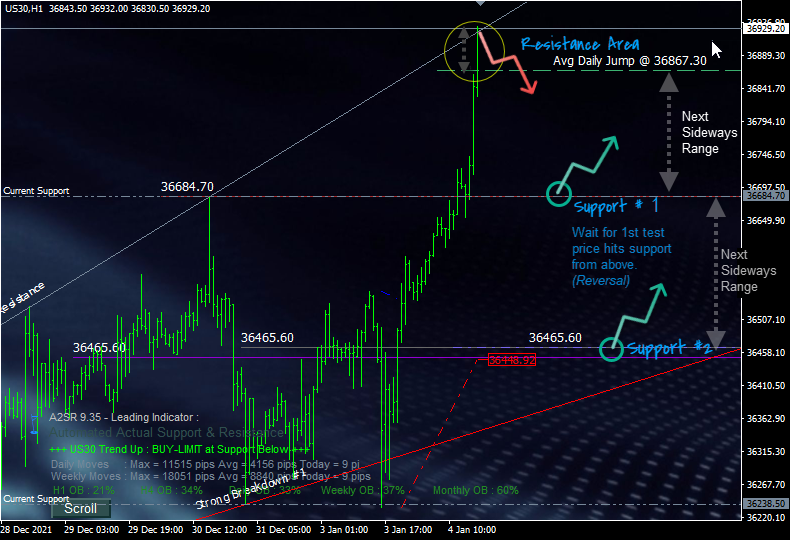
- number 8 in the screenshot fig. 1.

- - - Fig. 01 - - -
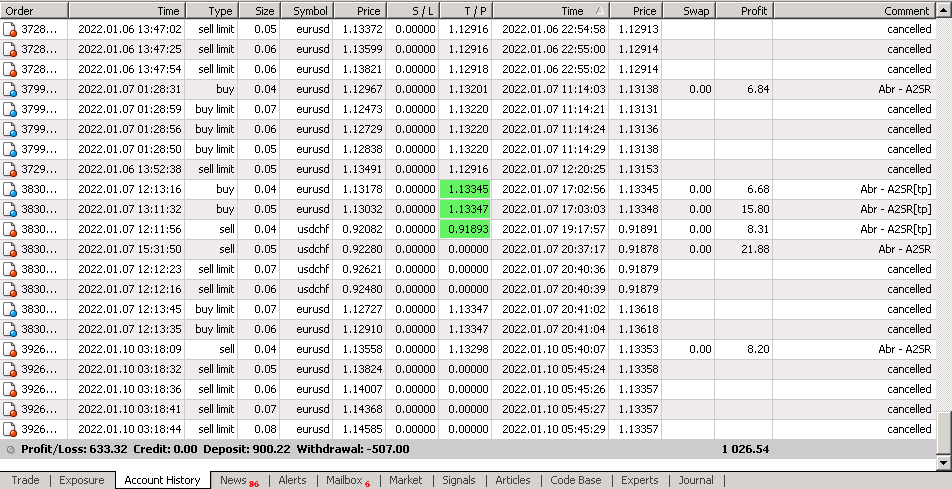
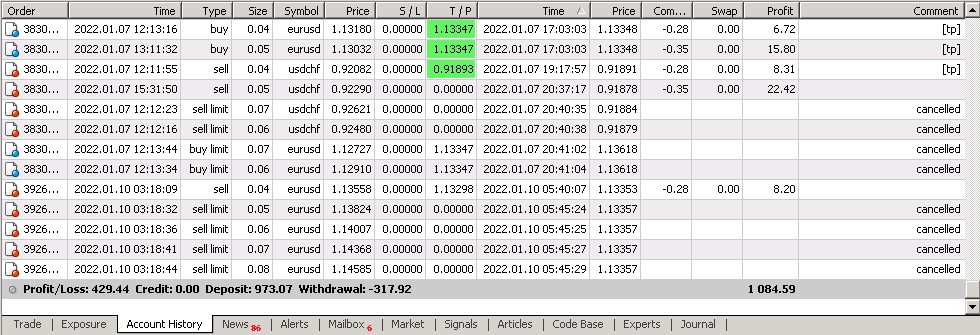
Sources
- US30 Prev. Week,
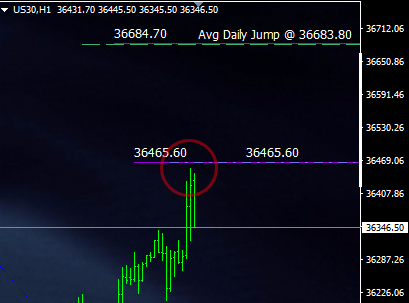
New Year - January 3, 2022
If you force a trade on January 3, 2022, - then please you still need more time to learn how to be a real trader.
- - - Fig. 02 - - -
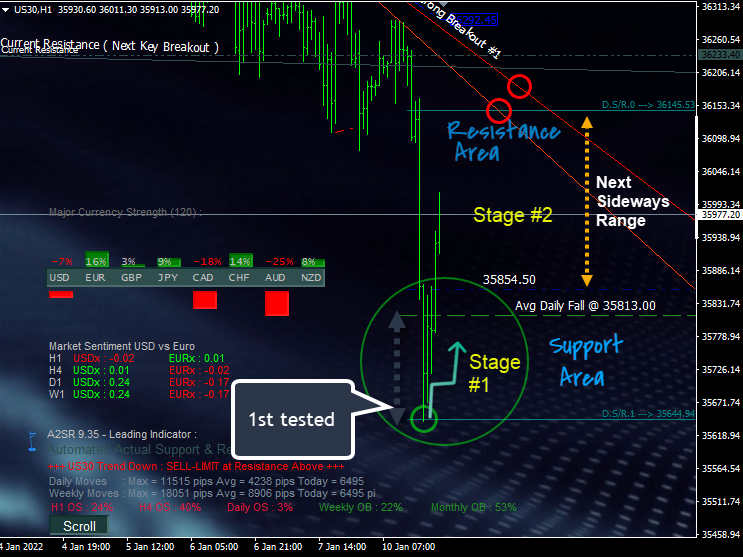
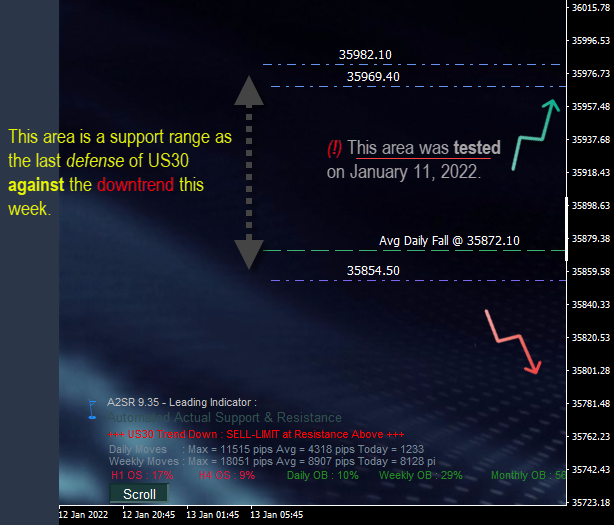
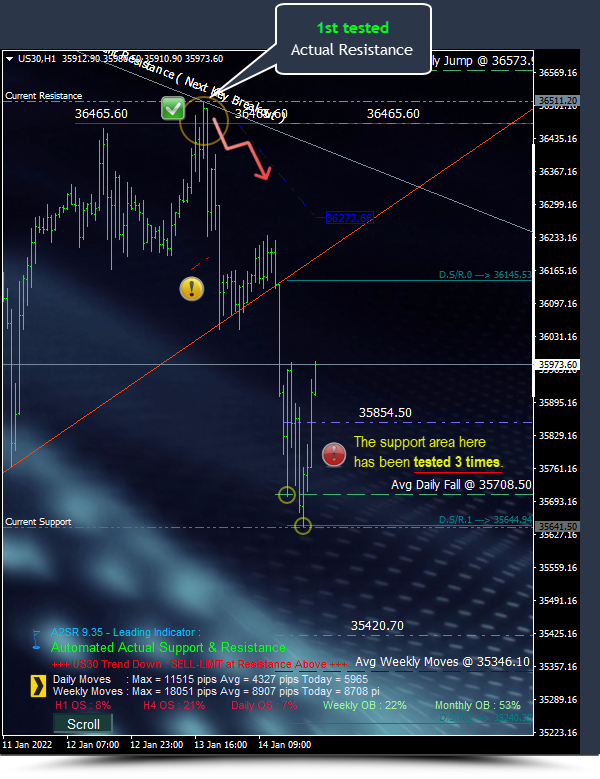
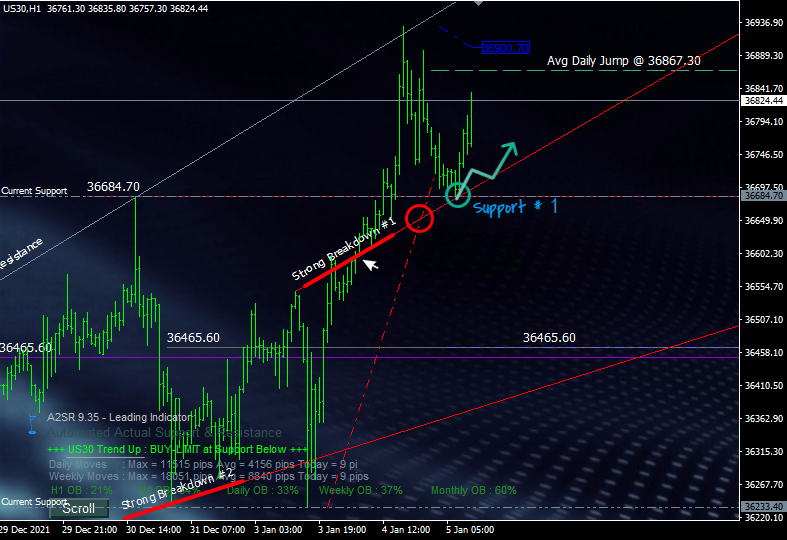
It's better to wait for next day, position at next Resistance, Support and Strong Breakdown. - US30, Jan 4, 2022.
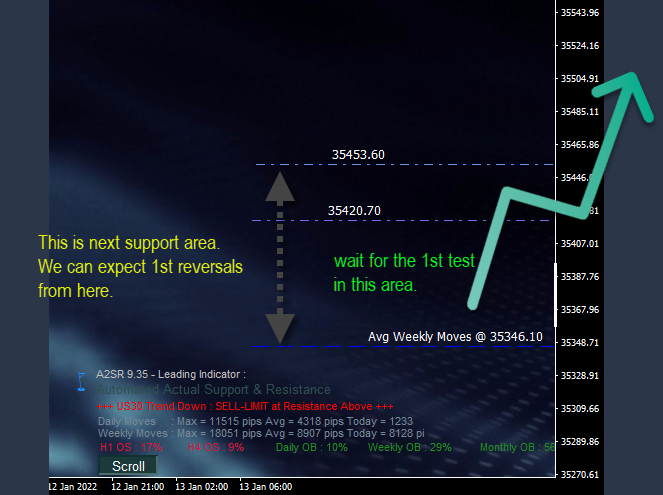
Price reached the resistance area.
Resistance area.
A zone of resistance is an upper boundary that the stock has not previously broken through,
and it is the opposite range to the zone of support.
1st test is a zone of actual resistance provides high probability areas where a reversal (pullback),
and 2nd test is continuation of an upward trend may occur (breakout).
Since the resistance area is just reached for the first time, it is a good time to go short (Sell) there.
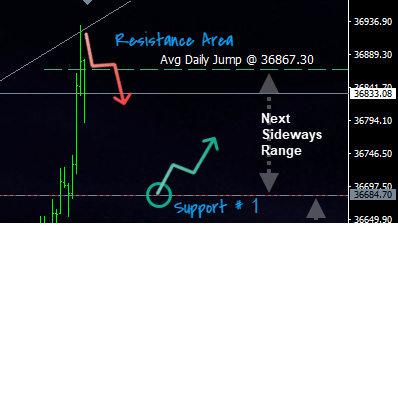
- - - Fig. 03 - - -
Note.
Current trend is uptrend, there is still a chance for a 1st test of Support 1 to go long (Buy) there.
Good news,
Short positions at resistance appear to have good hopes.
few hours later ...
the problem has just come, that's about psychology,
one of which is patience.
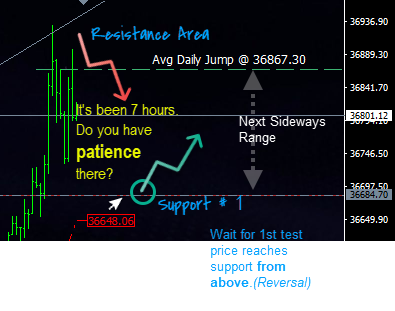
- - - Fig. 04 - - - The situation was not easy.
Generally people are confused about 2 options:
- closing position or waiting for price reaches the target at the 1st support.
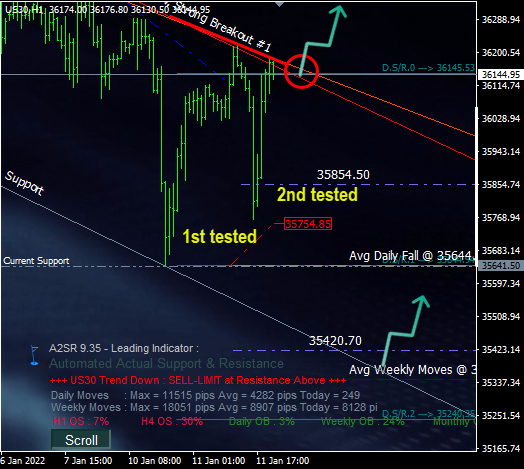
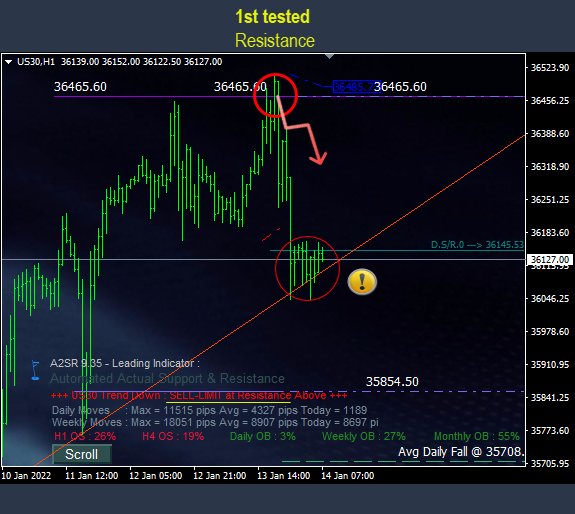
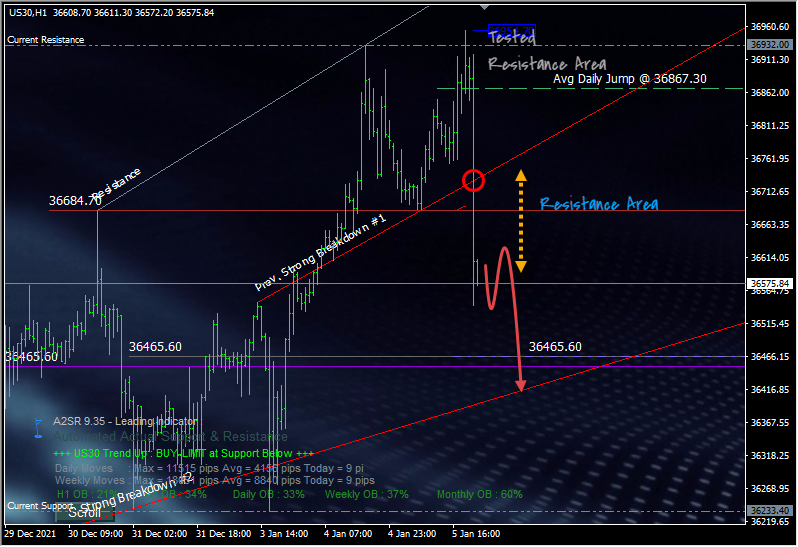
- Decision is depend on trading style. - US30, Jan 5, 2022
The price reached the support area.
The price should bounce off the actual support during the 1st test from above.
Support area :
A zone of support is a lower boundary that the stock has not previously broken through,
and it is the opposite range to the zone of resistance.
Actual support level provides high probability areas where a reversal (bounces) for the 1st test
and continuation of the trend may occur at 2nd test at support zone (breakdown).
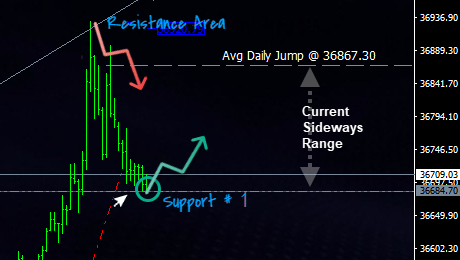
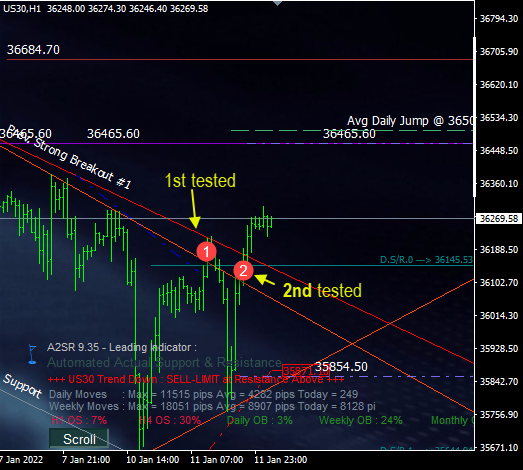
- - - Fig. 05 - - -
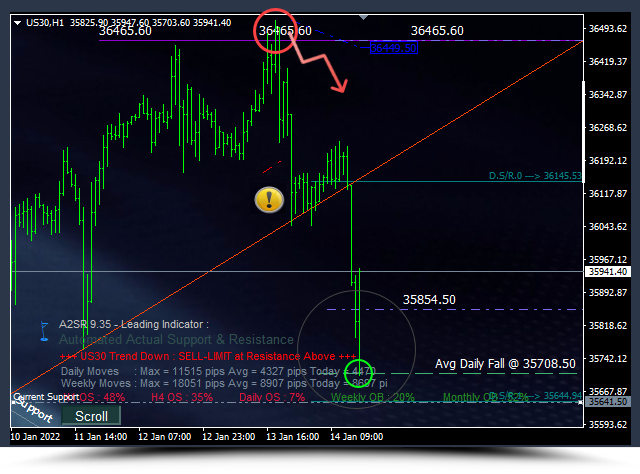
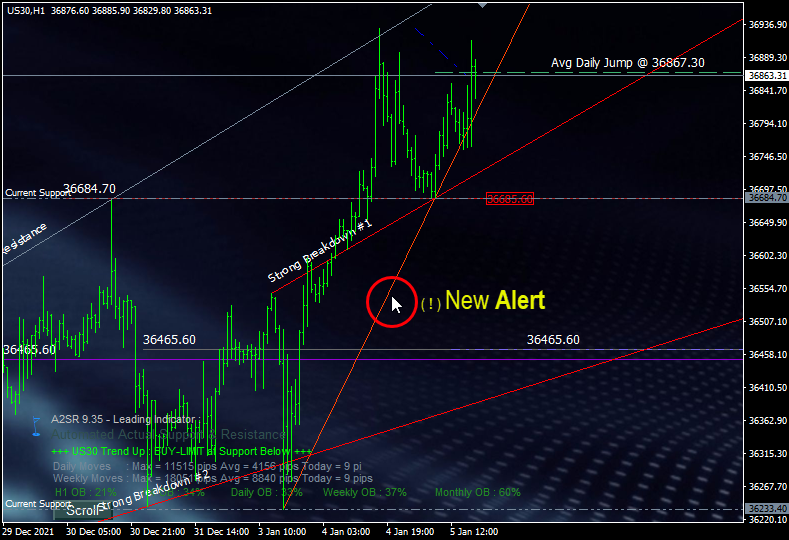
The current trend is an uptrend, but then a Strong Breakdown appears:
- It is an early sign that the trend may be ending soon or later.
(!) That's the time when we have to reduce the desire to open long positions.
(i) Long positions at Support #1 can be closed accordingly.
- - - Fig. 06 - - -
(!) The trade plan in Fig. 03 should be revised. During a strong breakdown situation, then
(i) support #2 might be broken, and the previous support level can become a new resistance.
- - - - -
After the Strong Breakdown, - A2SR still provide a second alert.
(i) Uptrend is on the edge of the cliff.
- - - Fig. 07 - - -
(!) and then .. the storm has arrived.
- - - Fig. 08 - - -
Ranging is usually started after rally.
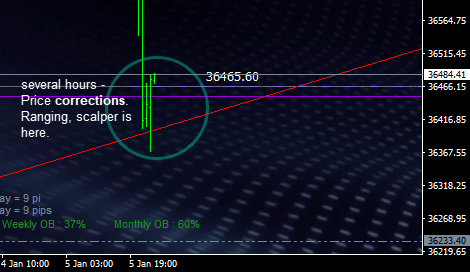
- - - Fig. 09 - - - - US30, Jan 6, 2022
The trend has turned into a downtrend.
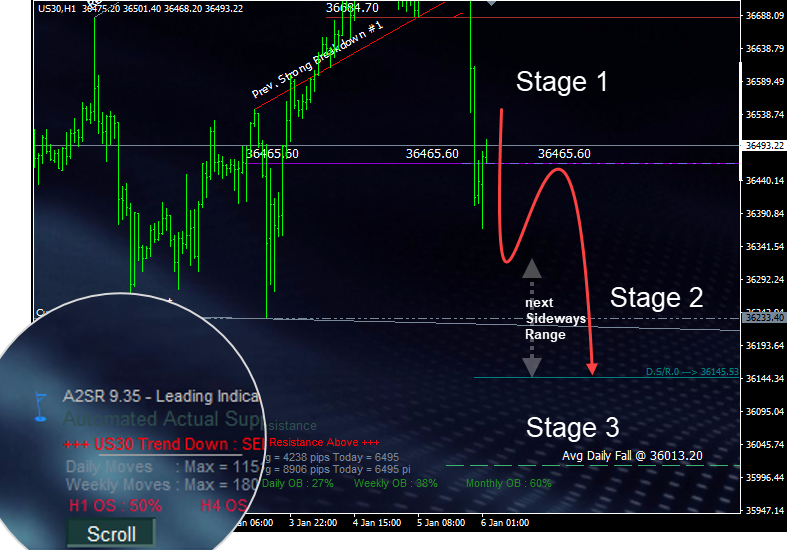
- - - Fig. 10 - - -
- Does anyone still want to maintain long positions?
- Stages in the market, reference at https://www.mql5.com/en/blogs/post/722511
1st test resistance from below :
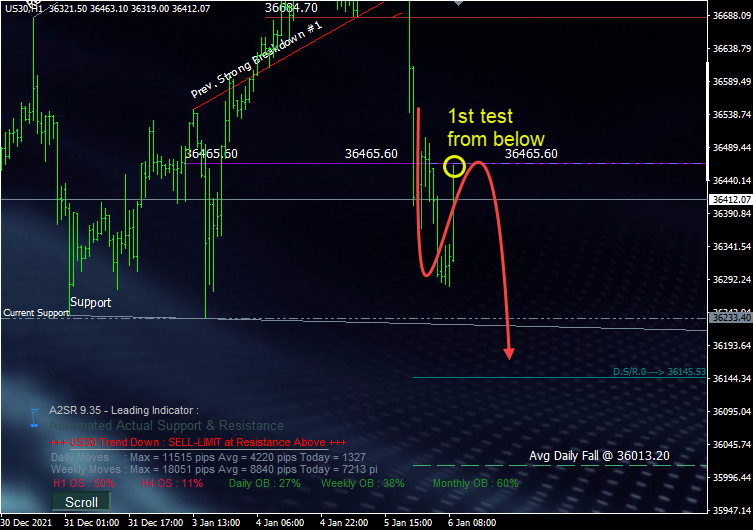
- - - Fig. 11 - - -
There is no difference with currency pairs because the market has the same style.
Reference at : https://www.mql5.com/en/blogs/post/734748/page2#comment_16275068
The price movers are carried out by the same group of investors.
Thanks for reading.
- As usual, my writing will still be continued on the live trade plan for this week.
Reference at : https://www.mql5.com/en/blogs/post/719353
If I have more time then I will provide a video as well.
Kind regards,
Yohana