
Binary Signal Guide
MT4: mql5.com/en/market/product/69603
In this post, you will see the help and details of this indicator
First run the indicator
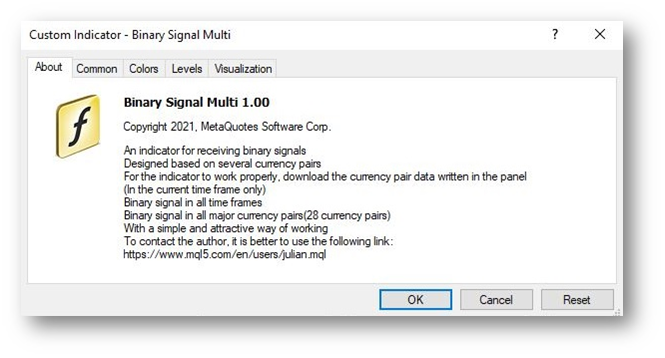
about :
After running it, you will see the following page
On this page, you will see the basic description of the indicator. You can also see the address of the manufacturer page on the MQL5 site at the bottom
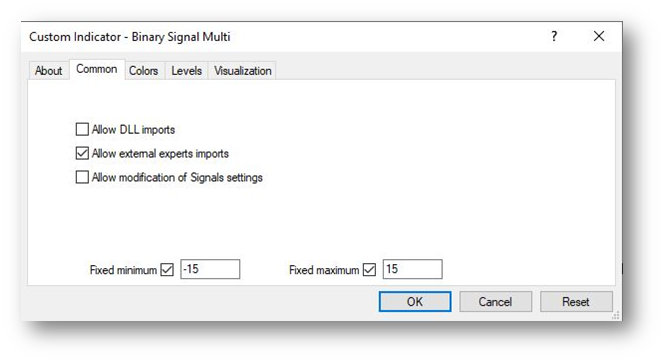
Common:
After viewing this page, click Next Page.
Here you can see the basic settings of the indicator. It is better not to change these settings.
Inputs:
In this section, you will see the main indicator settings that I have set to the best. So we do not have settings (in version 1)
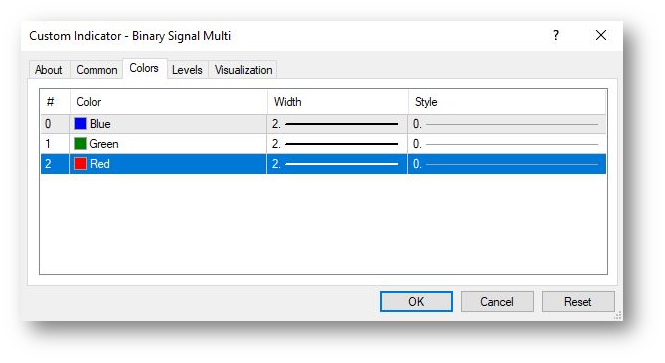
Colors:
In the fourth part, you can change the color of the indicator, its thickness and the type of display. Adjust which mode you are most comfortable with
Levels:
In this section, you can change the color, thickness and numbers related to the levels. You can add level. You can reduce. You can apply any change you want. Levels are gray lines on the indicator.
You can also change the description of each level. Everything is customizable.

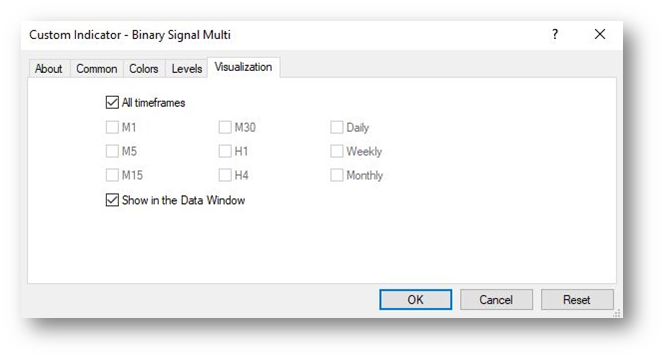
Visualization:
In this section, you can see the timeframes where the indicator is applicable.
It is better not to change the settings of this section.
Whatever settings you enable, the indicator can only be displayed in that time frame.
If you enable the “All” option, it can be run and displayed in all time frames.
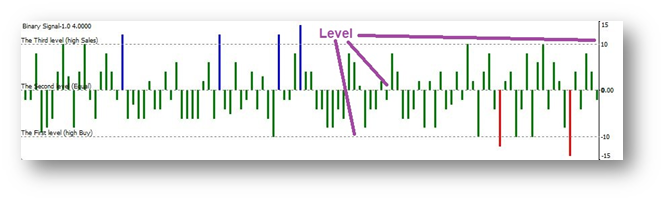
Signal receiving guide:
When the bar chart turns blue, it means we are overbought and the next candle is likely to go down
And when the bar chart turns red, it means we are over-selling and the next candle is likely to be bullish.
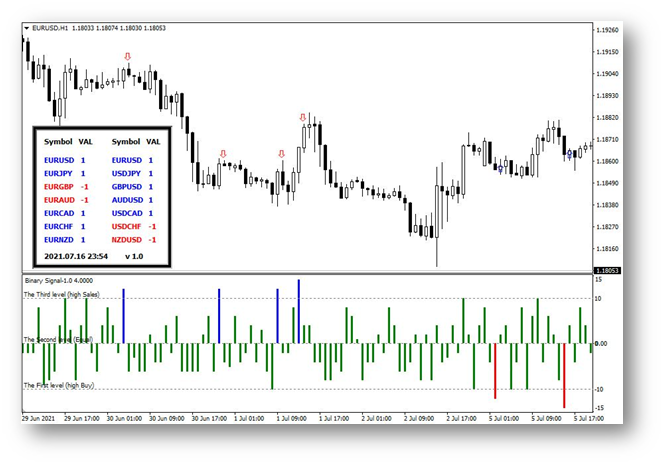
For example, in the image above, the first bar on the left is blue. So we have a bearish signal in the chart. This means that the next candlestick will most likely close "descending".
Note that it is better to decide multi-time. For example, if you have an ascending signal in a one-hour timeframe, find and trade an ascending signal in a 15-minute timeframe.
Instructions for using the panel:
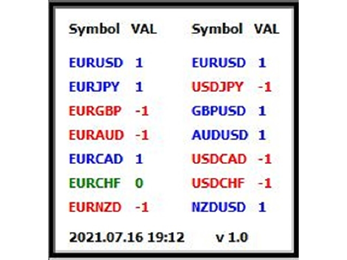
As you know, this indicator is based on 14 different currency pairs. So for the indicator to work properly, you need to download the data of these 14 currency pairs. You can see the list of these 14 currency pairs in the panel.
Two of the 14 currency pairs are duplicates. In principle, there are 13 currency pairs.
Each currency pair represents a number between negative one and 1. These numbers are added together with a change and you see the result in the indicator chart.
At the bottom of the panel you can see the indicator version and the time of the last panel update.


