
TECHNICAL ANALYSIS OF THE GBPUSD CURRENCY PAIR AT 12/08/2020
Yesterday the GBP / USD pair was trading lower and closed the day in the red around the $ 1.3045 price. Today the pair also dropped slightly, dropping to $ 1.3020. On the hourly chart, GBP / USD has broken and consolidated below the MA line (200) H1 ($ 1.3090). On the four-hour chart, the pair remains above the MA 200 H4 line. Based on the foregoing, it is probably worth sticking to the south direction in trading, and while the pair remains below MA 200 H1, it is necessary to look for a sell entry point to form a correction.
Resistances are at: $ 1.3090, $ 1.3130, $ 1.3185-00
Support levels are located at: $ 1.3010, $ 1.2980, $ 1.2945
The main scenario for the pair's advance is the continuation of the fall to $ 1.3010 (August 7 minimum). An alternative scenario implies consolidation above the MA 200 H1 level with a subsequent rise to $ 1.3185 (Aug 6 high).
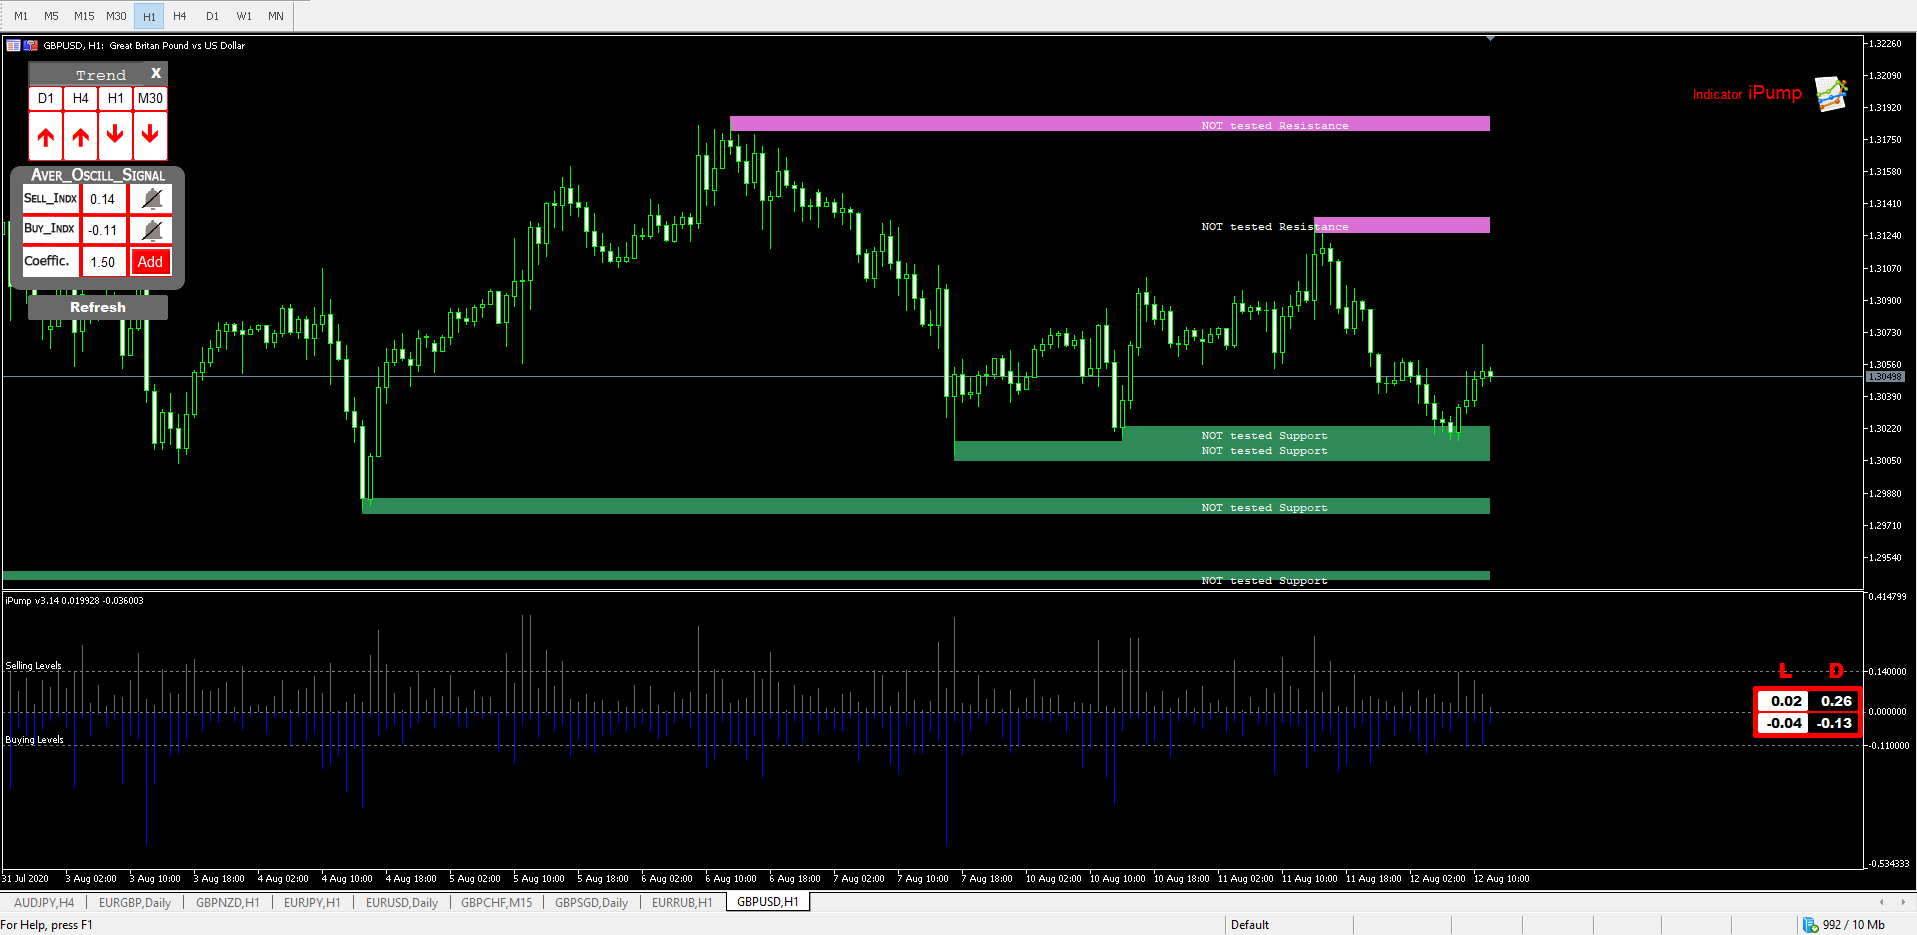
The iPump indicator was used for the analysis
https://www.mql5.com/en/market/product/39895
#GBPUSD, #Technical analysis of the GBPUSD at 11/08/2020, #forecast GBPUSD at 12/08/2020


