
Trading strategies with indicator SFT Full MACD overbought and oversold

SFT Full MACD overbought and oversold | Forex Indicator for MT4
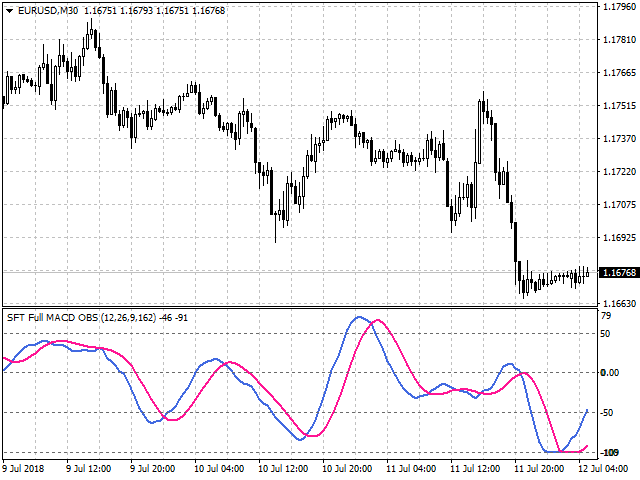
Indicator, which is more informative, thanks to overbought and oversold levels - for a more accurate representation of the situation on the market.
All the settings of moving averages are available, such as the average type and the price at which it is built.
It is also possible to change the display of the indicator - line or histogram.
Thanks to the additional parameters, it became possible to fine-tune, and the trade can be conducted both inside the channel and on the trend.
FREE trial download or buy the full version: https://mql5.com/4e034
Distinctive features
Has overbought and oversold levels;
Does not redraw;
Additional parameters for fine tuning;
Display as a line or as a histogram;
Works on all timeframes and symbols;
Suitable for manual trading and for the development of advisers.
For more accurate inputs and additional confirmation of signals can be used in conjunction with other indicators.
Indicator settings
OBS_Period - period for calculating the values of overbought and oversold levels.
Line_or_Histo - display of the indicator true - as a line, false - as a histogram.
Period_FastMA - the period of the fast moving average;
Period_SlowMA - the period of the slow moving average;
Period_SignalMA - the period of the signal moving average;
Method_FastMA - type of fast moving average;
Method_SlowMA - type of slow moving average;
Method_SignalMA - the type of the signal moving average;
Price_FastMA - prices for building a fast moving average;
Price_SlowMA - prices for building a slow moving average;
Trade recommendations
If the histogram (line) is near the levels 100 or -100, then the probability of a price turn is high.
If the histogram (line) crosses the levels 50 or -50, then the probability of continuation of the price movement in the same direction is high.
If the histogram (line) is above zero and the highs are rising, then there is an uptrend in the market.
If the histogram (line) is below zero and the lows fall, then there is a downtrend in the market.
The appearance of local minima and maxima on the histogram indicates that the price may turn around or begin correction.
If the histogram (line) crosses the zero level from the top down - this is a sell signal, if the bottom-up is a buy signal.
Classical signals of divergence between the indicator and the price chart are additional confirmation signals.
The direction of the transaction should correspond to the direction of the trend on the older timeframe.
Exit from the transaction on a reverse signal or on established SL and TP.
When using SL and TP, it is desirable to install SL for the nearest extremum, TP = 1..2 SL.
There are other options, in the process of trading you can develop the most convenient tactics for you.
FREE trial download or buy the full version: https://mql5.com/4e034
Thank you for using our software.
If you like it, then do a good deed and share a link with your friends.
In order not to miss the release of new useful trading programs - join friends: SURE FOREX TRADING


