Indicator description.
The Strongest Alligator indicator or “Alligator Analysis” (AA) indicator is an improved value of the classic Alligator by Bill Williams.
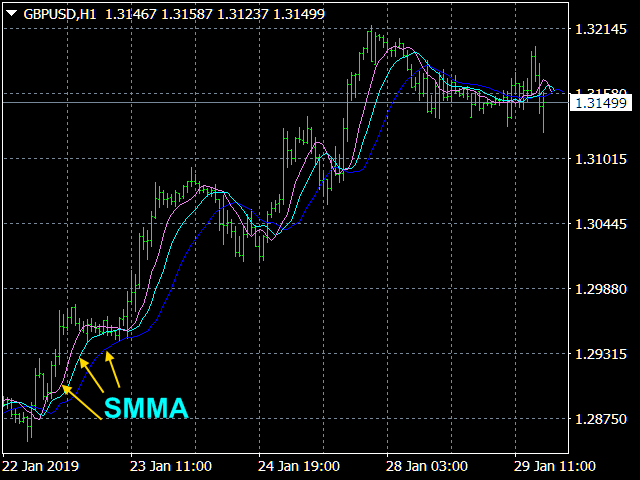
The “Alligator Analysis” (AA) indicator allows you to build various (by averaging types and by scales) “Alligators” and their combinations, i.e. allows you to analyze the state of the market based on the correlation of this state with a whole range of different "Alligators". The classic " Alligator" by Bill Williams is based on moving averages and Fibonacci numbers, which makes it one of the best indicators now. The classic " Alligator " is based on Fibonacci numbers and is a combination of three smoothed moving averages (SМMA) with periods 5, 8 and 13, which are part of the Fibonacci sequence. In this case, the moving averages are shifted forwards by 3, 5, and 8 bars, respectively, which are numbers from the same sequence (preceding the corresponding period values).
Alligators from the AA indicator is based, on the same principle as the classic “Alligator”, but on different parts of a number of Fibonacci numbers, as well as on different moving average averaging algorithms.
First of all, in the AA indicator you can create 8 types of alligators and their combinations:
-
Fast alligator with periods (3,5,8) and shifts (2,3,5);
-
Classic alligator - (5,8,13) and (3,5,8);
-
Big alligator - (8,13,21) and (5,8,13);
-
Huge alligator - (13,21,34) and (8,13,21);
-
Monster - (21,34,55) and (13,21,34);
-
Fast and Huge - (3,5,8,13,21,34) and (2, 3, 5, 8, 13, 21);
-
Classic and Monster - (5,8,13,21,34,55) and (3,5,8,13,21,34);
-
All alligators - (3,5,8,13,21,34,55) and (2, 3,5,8,13,21,34).
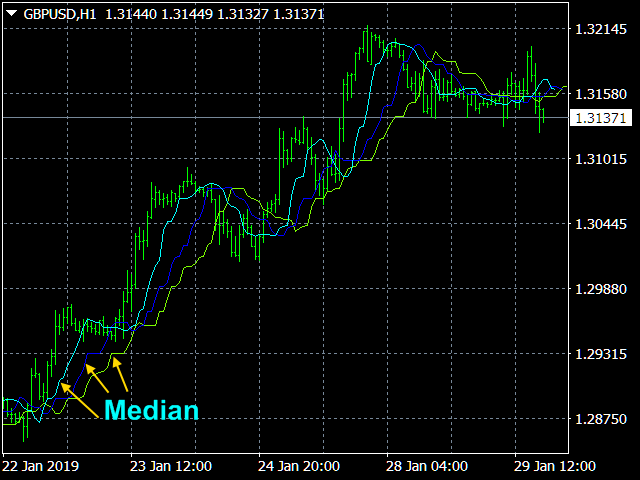
Secondly, the indicator AA uses 6 types of averaging, where the classical averaging SMA, EMA, SMMA, LMA are supplemented by averaging the moving average by the median and averaging weighted by volume.
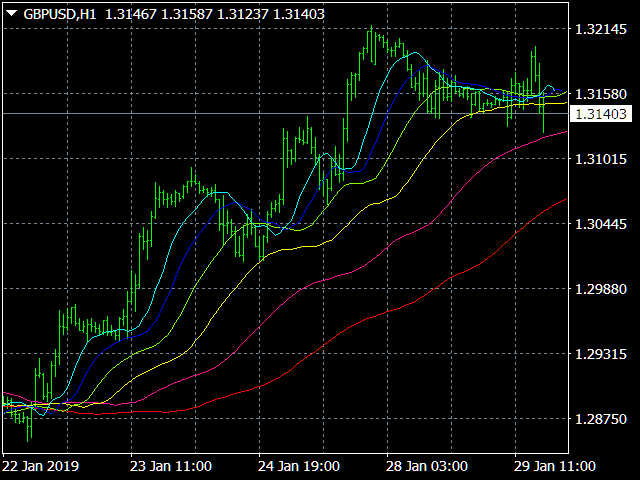
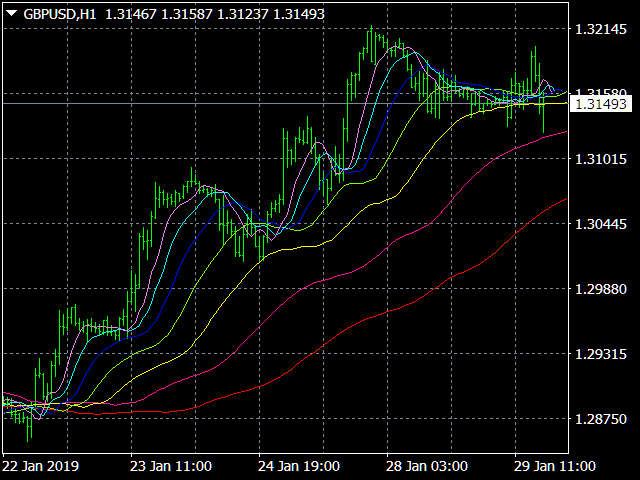
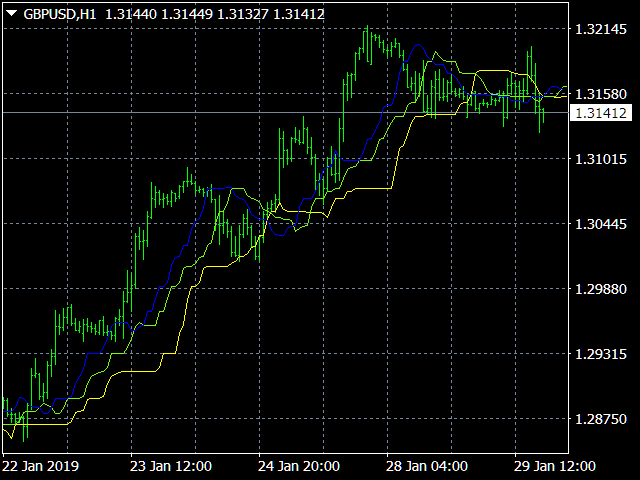
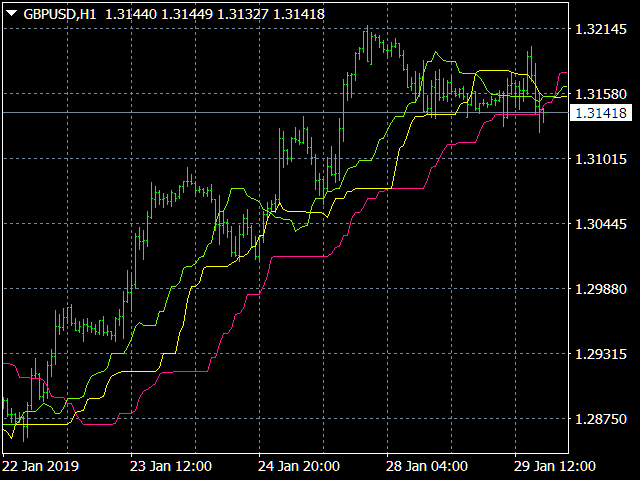
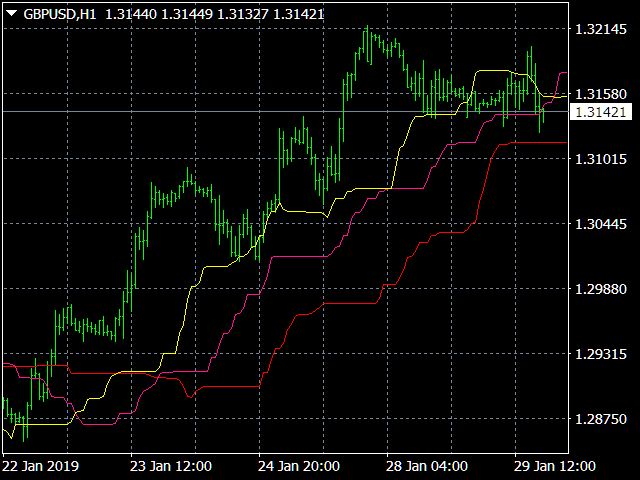
Line shifts can be removed. The colors of the AA indicator lines are set according to the type of color spectrum: from violet for a small smoothing period to red - for the largest period.
Application of "Alligator Analysis" in trade.
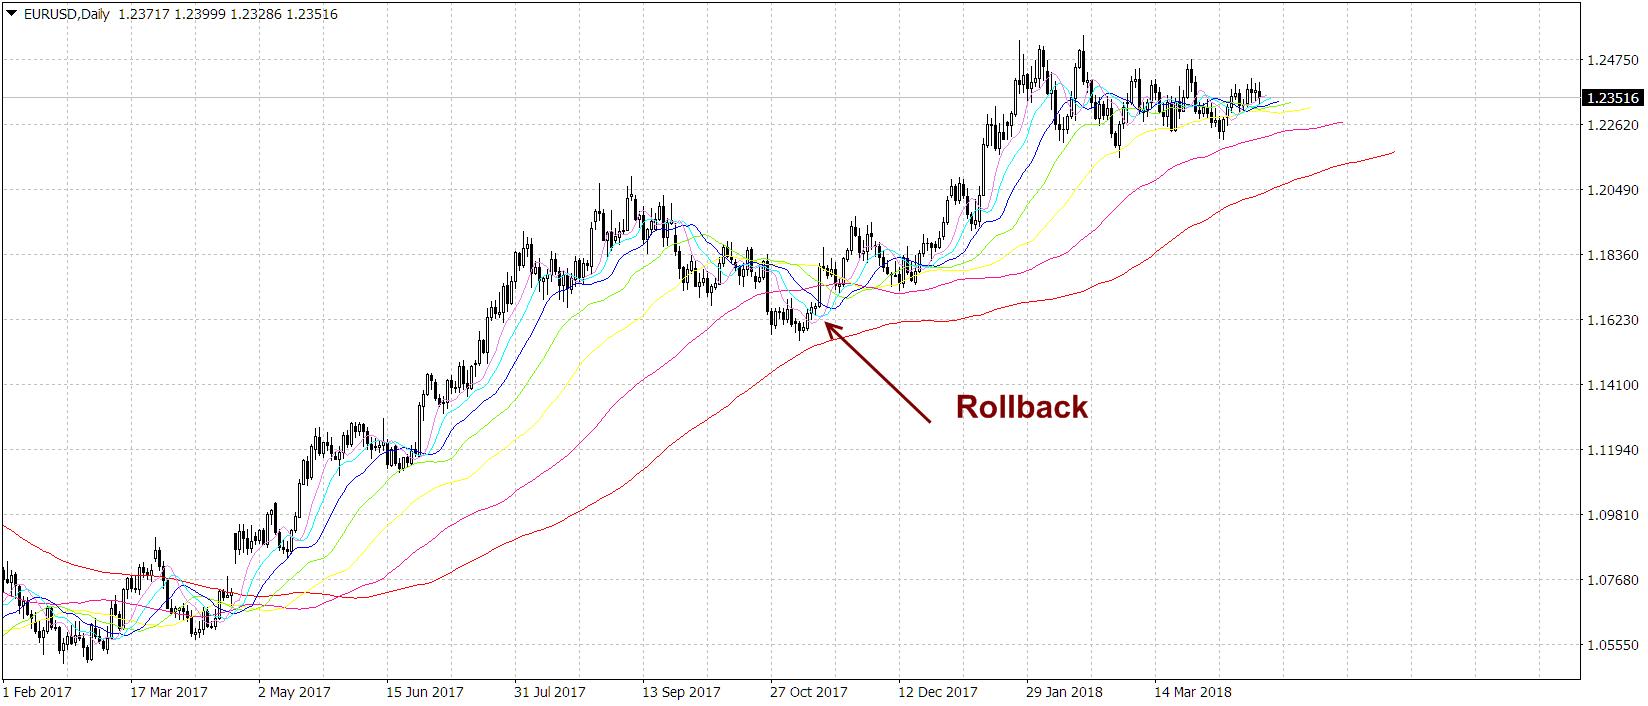
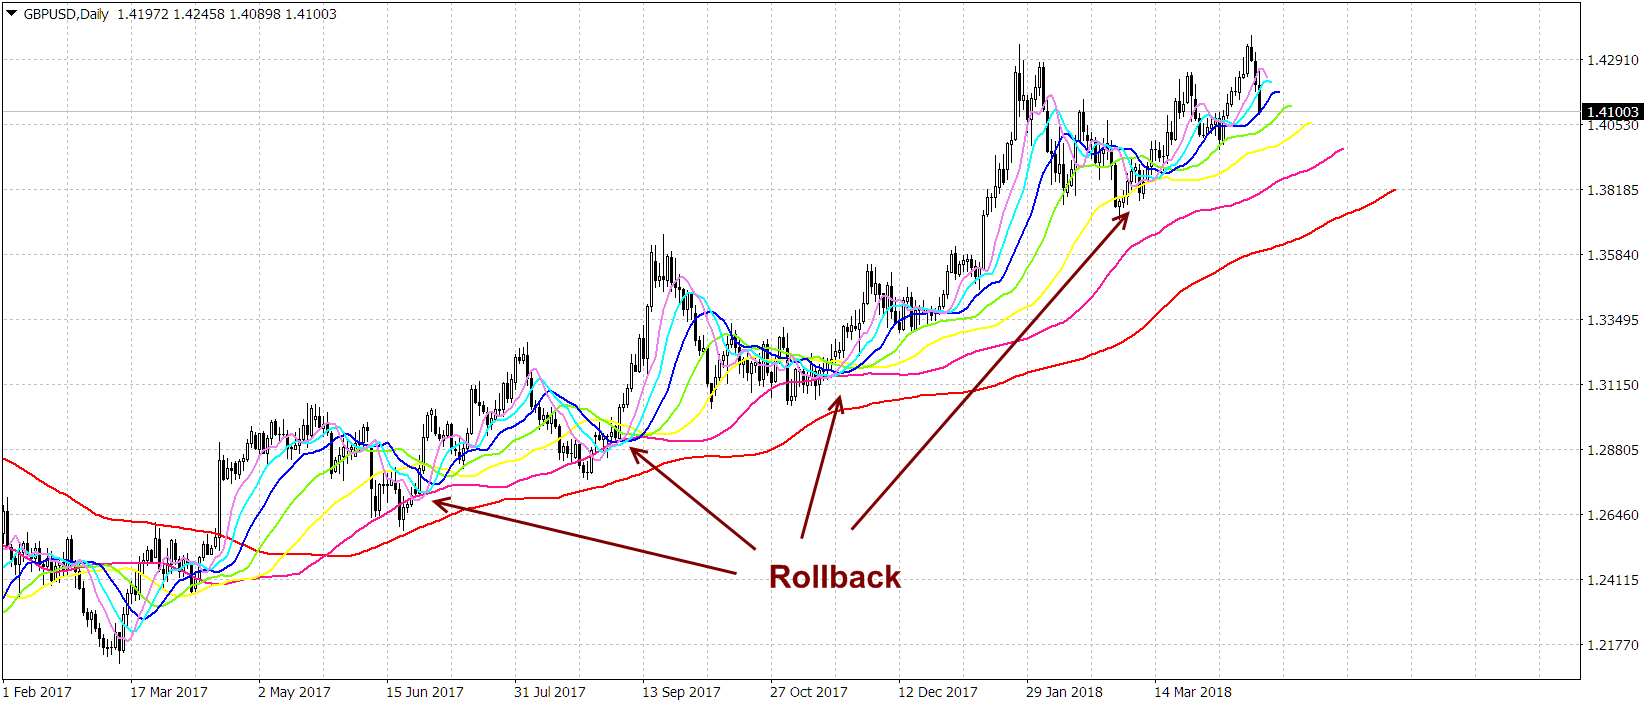
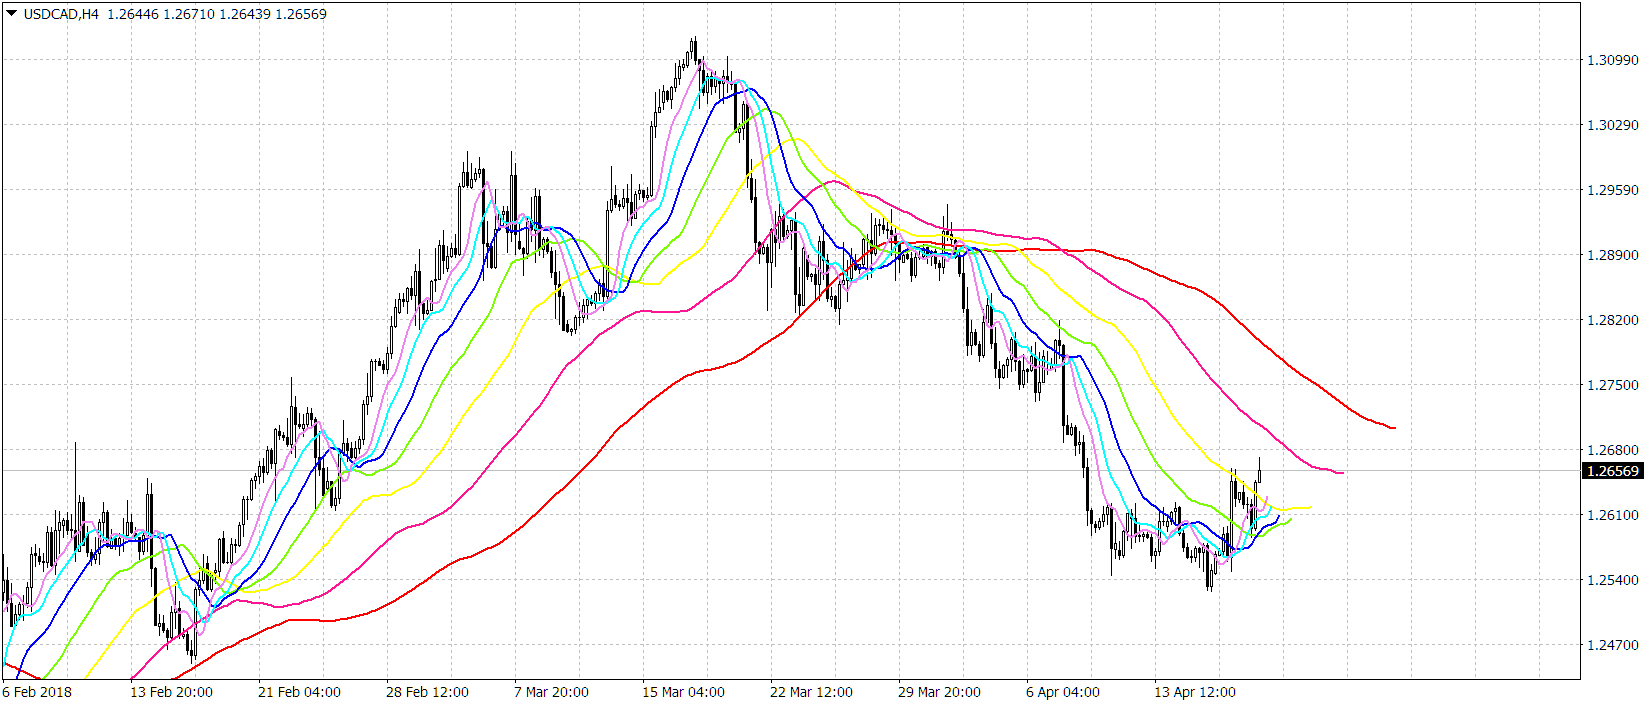
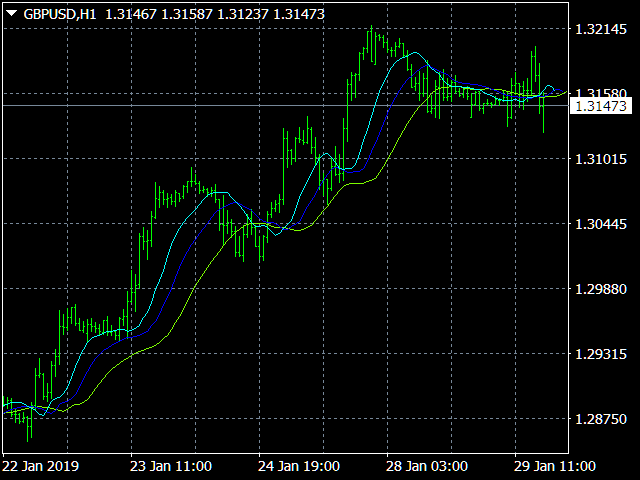
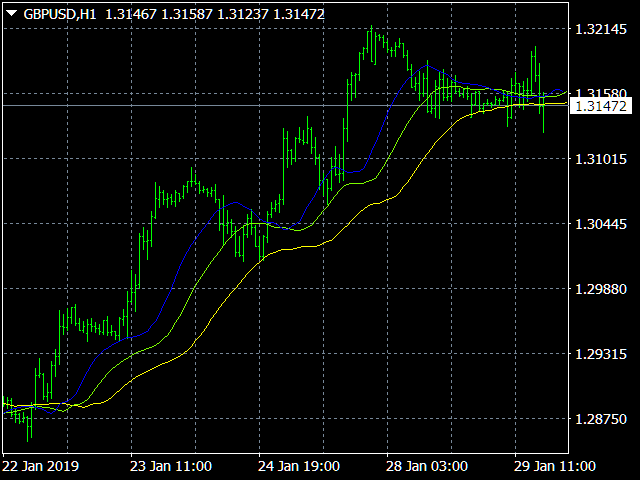
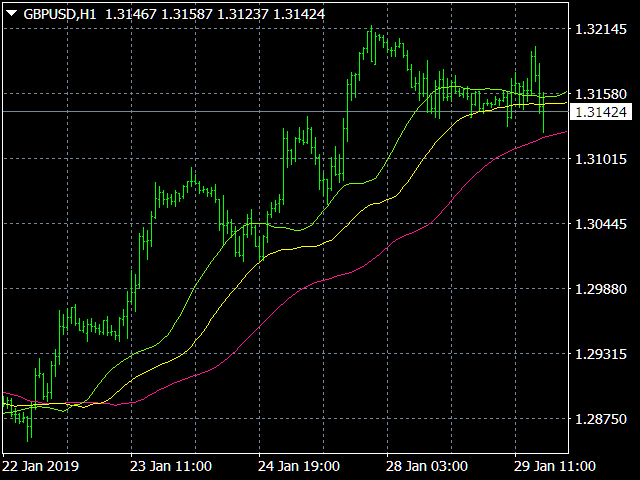
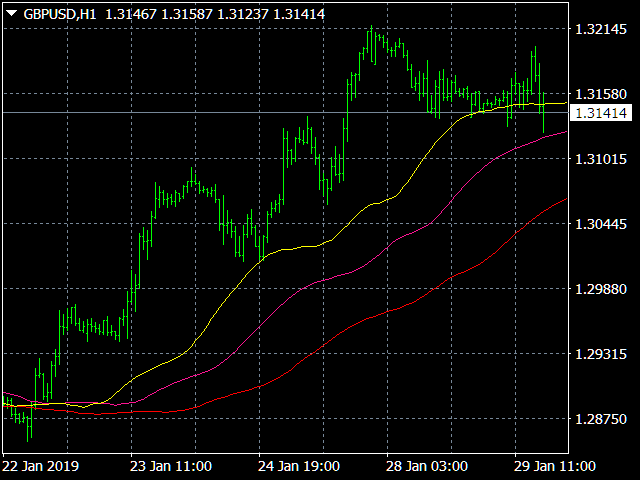
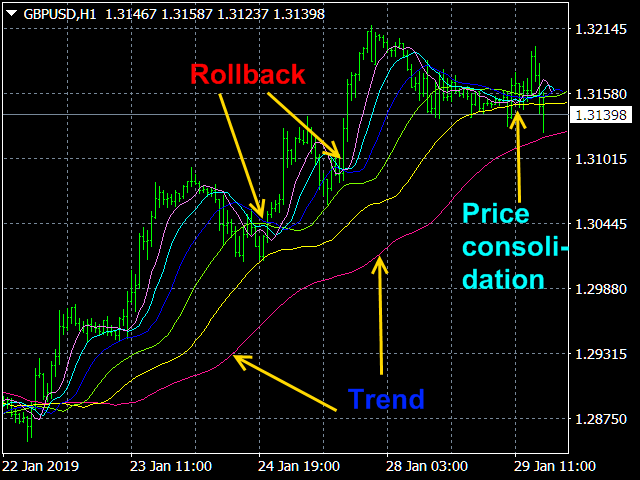
In the “Fast alligator”, “Classic alligator”, “Big alligator”, “Huge alligator” and “Monster” modes, you can evaluate market trends in their respective (incremental) time scales. In “All alligators” modes and near to it - “Fast and Huge” and “Classic and Monster” - the indicator “Alligator Analysis” allows you to see market tendency of different (but important for trading on this chart) time scales on the same chart. As a result, it is easy to visually identify not only the states of (A) price consolidation near a level (convergence and interlacing of lines, which become horizontal), (B) the beginning of trends ("opening the mouth of a crocodile") and (C) their ends (interlacing of lines, indicating a new consolidation), as in the classic Alligator, but also (D) rollbacks of trends.
Namely, if the "mouth of the crocodile" is widely open on moving averages with large periods, which have a trend identified on their timeframes, while a consolidation starts on the moving averages of smaller scales, then a trend rollback is likely to take place. At the same time, the length of a trend on the corresponding timeframe is usually proportional to the length of the preceding consolidation area (of the same scale), where the market remains most of the time (70%-80%), which provides additional information for evaluating the market situation, i.e. allows seeing if a trend rollback is beginning or ending. A rough estimate is that if the trend lasted for 25% -40% of the time of the consolidation before it, then, most likely, there will not be a trend rollback, but a trend end; if the trend lasted less than 20% of the time of the previous consolidation, the convergence of the fast lines of the indicator « Alligator Analysis» indicates a rollback.
More precisely, the extent of consolidation areas can be judged on the basis of the indicator Probabilities distribution of price .
Indicator parameters
- Price type - Values: Close price, Open price, High price, Low price, Median price ((high + low)/2 – default), Typical price ((high + low + close)/3), Weighted price ((high + low + 2*close)/4).
- Alligator type - Values: «Fast alligator», «Classic alligator» (default), «Big alligator», «Huge alligator», «Monster», «Fast and Huge», «Classic and Monster» and «All alligators».
- The averaging method - Values: SMA, EMA, SMMA (default), LMA, Median=(Max+Min)/2 and <xv>=<x*v>/<v> volume weighted.
- The moving averages shifting? Values: true (default), false.
Screenshots.