It was a rocky week for the stock market as the drop in the momentum stocks Tuesday caught many by surprise. The social media stocks bore the brunt of the selling with large drops in Twitter, Inc. (TWTR) and Facebook, Inc. (FB).
The market’s rebound Wednesday was followed by even heavier selling on Thursday’s opening but the major averages did close well off the day’s lows. The action last week appears to have been accompanied by a change in sentiment from the financial media.
In April and May, as well as during June’s impressive rally, the dominant opinion from the financial TV networks was that stocks were overvalued and could not go higher. There seemed to be a shift last week as the weakness in the stock market was often discussed as a buying opportunity.
What to Watch
The stock market roared into the Fourth of July weekend, but last week, some chinks in the stock market’s armor did appear. The recent increase in bullish sentiment has been accompanied by some signs of technical deterioration, which are noted below.
This means that we are likely in the process of building a short-term top. I do not expect the market to drop sharply over the near term, but if it did, that would actually be a positive as it could create an oversold extreme. A more likely scenario is that we will see another rally phase and marginal new highs cannot be ruled out.
This would give the technical indicators and their WMA more time to flatten out before they start to roll over. On the downside, the S&P 500 could drop down to the 1890-1910 level, which is just over 3% below current levels and the quarterly pivot at 1914.
Those stocks with weak relative performance analysis are likely to be the most vulnerable. I do not see enough risk for investors in the well-diversified large-cap ETFs I recommended in A Portfolio That Won’t Ruin Your Summer to change their strategy.
For those in individual stocks, they should be looking to reduce their exposure. I took some profits in Alcoa, Inc. (AA) last week after its earnings as it now seems to be on everyone’s buy list. I will be reviewing the Charts in Play portfolio next week.
The bullish percentage for the AAII did not change much last week as it was down less than 1%. The bearish percentage rose 6% as those in the neutral category apparently turned bearish.

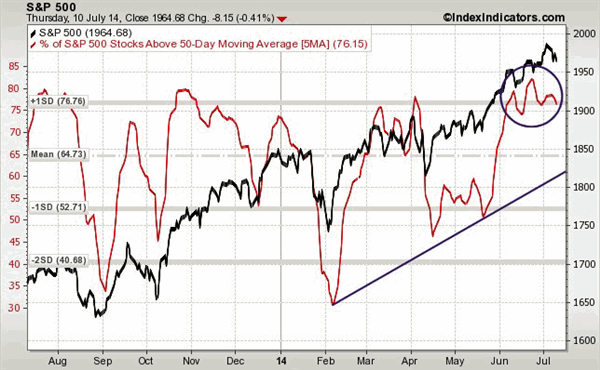
The five-day MA of the % of S&P 500 stocks above their 50-day MAs
has dropped down to 76.1% and—as the chart indicates (see circle)—is
looking more toppy. And one standard deviation above the mean at 64.7%
is definitely in a higher-risk area.
The uptrend, line a, is now in the 57% area but a drop down to the 50% level would not be surprising.
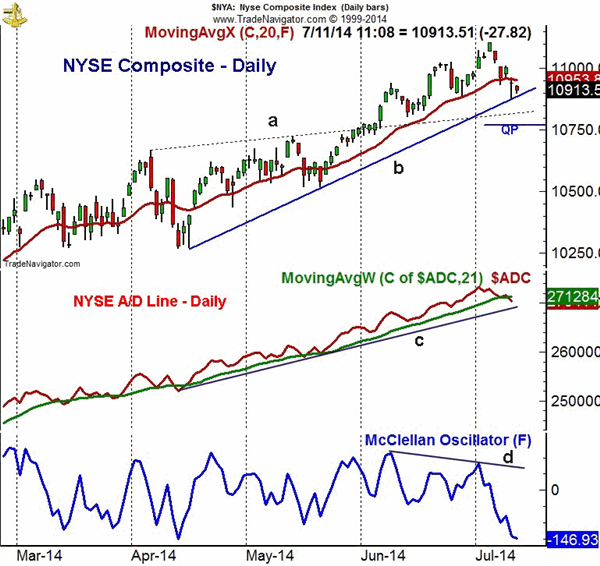
The daily NYSE Composite (NYA) will close the week below its
20-day EMA for the first time since late May. The daily uptrend, line
b, was tested last Thursday.
A daily close above last Thursday’s high at 10.962 should be enough to stabilize the chart. There is strong resistance in the 11,050-11,105 area with the monthly projected pivot resistance at 11,207.

The former resistance (line a) now becomes first support in the 10,800-850 area with the quarterly pivot 10,758.
The weekly NYSE Advanced/Decline did confirm the recent highs and
this is a bullish sign for the intermediate-term. The daily A/D line
made a new high in early July but closed the week below its
still-rising WMA. This makes the strength of the A/D ratios important
on any rally this week. It is still well above the uptrend, line c.
The McClellan Oscillator dropped sharply last Monday as the support
from the June lows was broken. At -147 it is slightly oversold. At the
February lows it was -198 but at more important levels it can drop as
low as -300
S&P 500
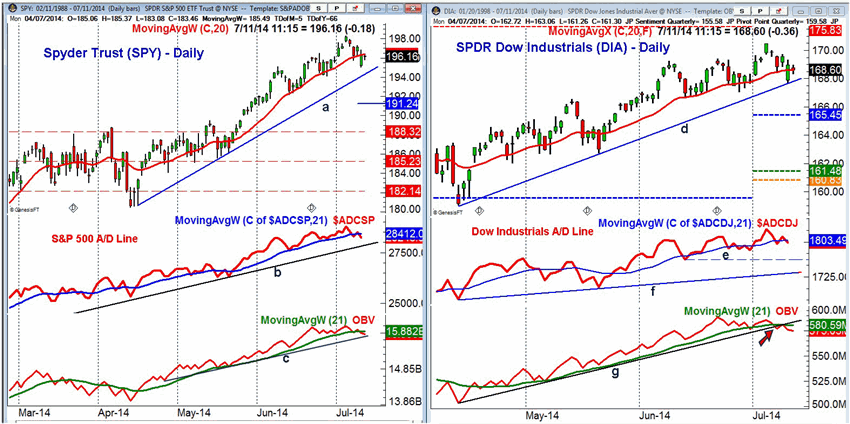
The Spyder Trust (SPY) spiked to a high of $198.29 on July 3
before dropping to $195.06 at Thursday’s early low. This is now
short-term support with the monthly pivot at $194.42, which corresponds
to the uptrend, line a.
The quarterly pivot is significantly lower at $191.24 with the April
high and the 38.2% Fibonacci support at $188.80 and $188.35
respectively.
On the upside, near-term resistance at $197.30, which if overcome, could trigger a move to new highs.

Nasdaq 100
The PowerShares QQQ Trust (QQQ) had a classic test of the upper
boundary of its trading channel (line a) before the recent pullback.
So far, the 20-day EMA at $93.82 appears to have support with the
monthly pivot at $92.82 (courtesy of John Person‘s software). The monthly projected pivot support is at $91.49.
A close back above $95.40 should signal a move to new highs with the
monthly projected pivot resistance at $96.56 with the weekly starc+ band
closer to $97.50.
The Nasdaq 100 A/D line surged to new highs at the start of the month
but is now slightly below its WMA. There is additional support from the
spring lows at line c.
The daily OBV pulled back to its rising WMA last week but did make an
impressive new high as the upper trend line was being tested. There is
next support at the June lows with the uptrend, line d, much lower.
Russell 2000
The iShares Russell 2000 Index (IWM) has been hit hard since it
made an intra-day high of $120.97 on July 1. IWM is already close to
the monthly pivot support at $113.64 but looks ready to close the week
above the quarterly pivot at $115.05.
The declining 20-day EMA is now at $116.83 with further resistance in the $118-$119 area.
The Russell 2000 A/D never was able to surpass the March highs on the
recent rally and has now clearly broken its downtrend. Its WMA is
starting to flatten out and a rebound back to its WMA could signal a
rally failure.
The daily OBV also did not confirm the highs and is well below its WMA. There is further OBV support at line f.


