THE 8 YEARS GOLD CYCLE FORECAST
We noticed that there is a dominant cycle inside gold market, the 8 years cycle, that could really help us to forecast this market.
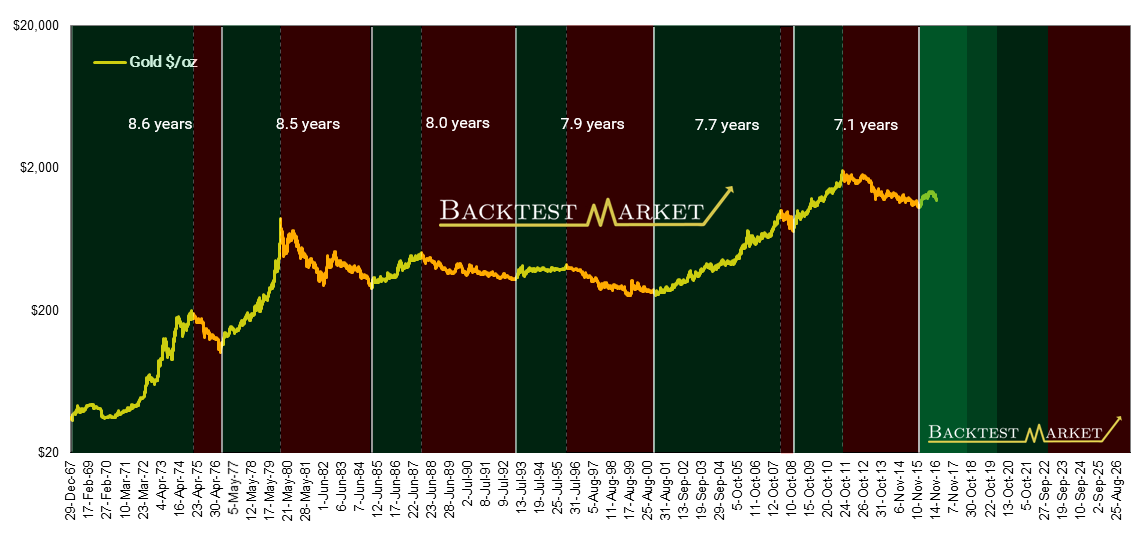
I marked with vertical white lines the most important lows (lows which is not revised for years) of the last 50 years, each about 8 years of time distance.
The chart shows GOLD ($/oz) in logarithmic scale.

For example: the 1st cycle started in 1968 and ended in 1976 after 8.6 years (that is 8 years and 8 months).
Before 1968 gold price were fixed by US government at 35$/oz. The 2nd cycle started on 30.Aug.1976 (102$).
The 6th low was on 13.Nov.2008 (708$).
And the 7th low (the last one) was on 18.Dec.2015 (1.052$).
About cycle low’s time distance we have 2 key indications:
a) the average is 8.1 years.
b) the low distance is decreasing with the passage of time. It is the fifth time (5/5) that the distance beetween lows are getting shorter.
TIME TARGETS
When I’m writing (Feb.2017), we are 8.2 years apart from 2008 low, so we are already above the average of 8.1 years.
The maximum historical distance is 8.6 years. If we add 8.6 years to Dec.2015, the minimum will be at July 2017.
And every day that passes and the price increases reduces the chances to have a new low, going below 1,045$.
Now let’s split cycles in their bullish and bearish phases:

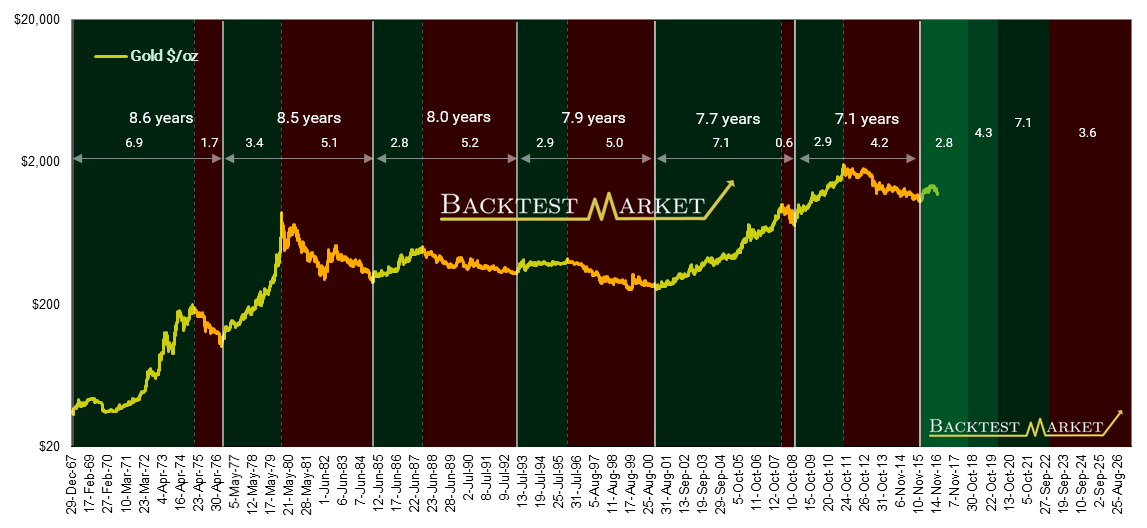
Now I add to the graph the time duration of the positive and the negative phases (in years):

How to read the chart
For example: the first cycle started in 1968 and ended in 1976 (8.6 years).
And inside this cycle, the bullish trend started in 1968 and ended in 1974 (6.9 years) then the bearish trend started from 1974 peak and ended in 1976 (1.7 years).
The numbers in the right side of the chart means:
2.8 years: it’s the shorter duration of bullish phases;
4.3 years: the average duration of bullish phases;
7.1 years: the longer duration of bullish phases;
3.6 years: the average duration of bearish phases.
So the numbers tell that the new bullish trend started on Dec.2015:
a) it will not make his maximum untill October 2018 (shorter duration);
b) more likely it will peaked about April 2020.
c) will do the maximum after 7.1 years from the 2015’s low, which means that the maximum will be done within January 2023.


