Dax Index Technical Analysis 2016, September: bullish breakout or ranging for direction
1 September 2016, 11:39

4
212
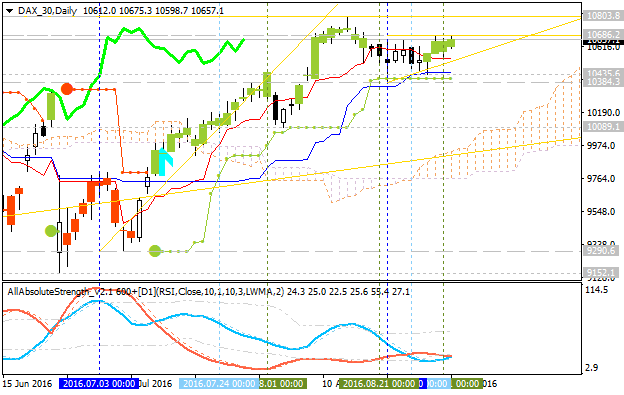
Daily price is located above Ichimoku cloud in the bullish area of the chart: the price is testing 10,686.2 resistance level together with ascending triangle pattern to above for the bullish trend to be continuing with 10,803.8 resistance as a nearest bullish target to re-enter. Absolute Strength indicator is evaluating the bullish trend to be continuing in the near future.
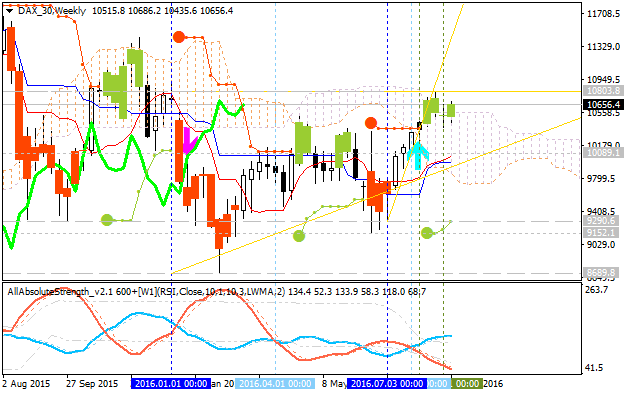
Weekly price is on the breakout with the bullish reversal since the beginning of July this year: price is testing 10,803.8 level to above for the bullish trend to be continuing.
If W1 price breaks 10,803.8 resistance level on close bar from below to above so the bullish breakout will be continuing.If W1 price breaks 10,089.1 resistance level on close bar from above to below so the bearish reversal of the weekly price movement will be started.
If not so the price will be on ranging within the levels waiting for direction.
| Resistance | Support |
|---|---|
| 10,686.2 | 10,089.1 |
| 10,803.8 | 9,290.6 |