AUDUSD Technical Analysis 2016, 28.08 - 04.09: daily correction to the possible bearish reversal
27 August 2016, 15:14

14
182
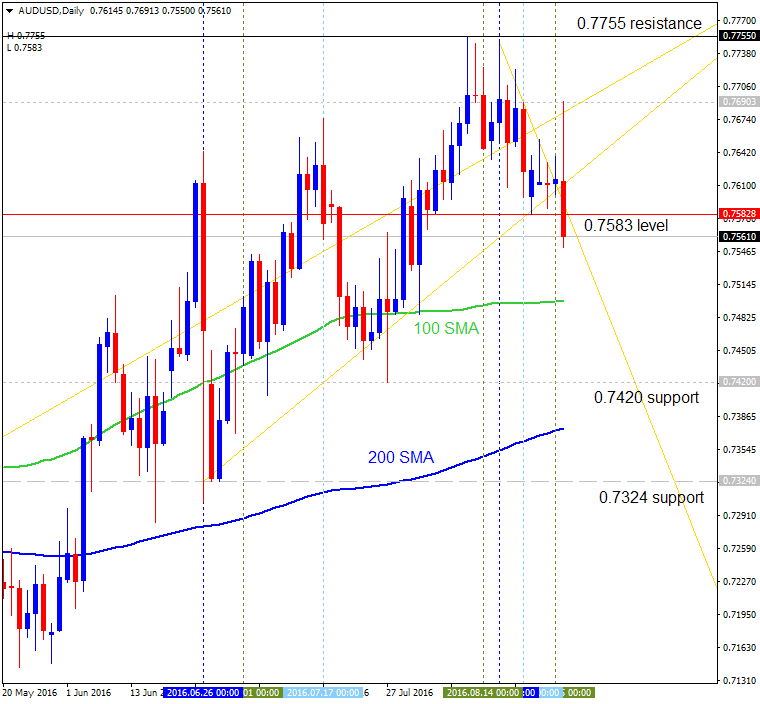
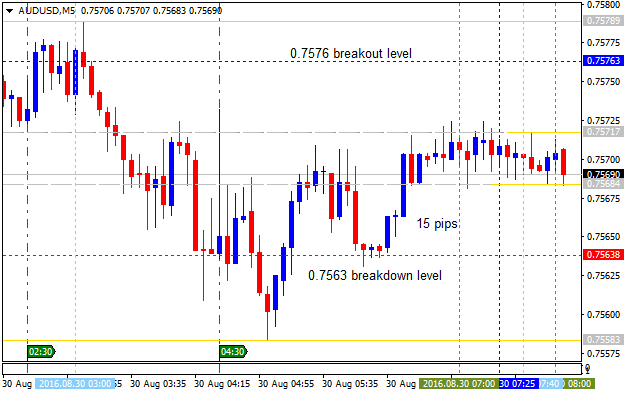
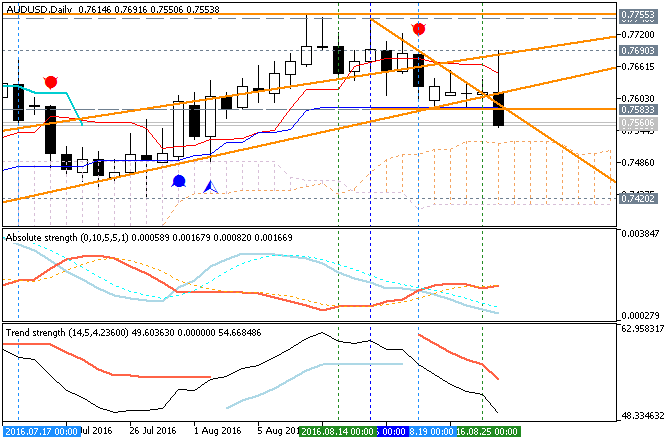
Daily price is breaking 0.7583 support level to below for the daily secondary correction within the primary bullish trend .
- The price is breaking descending triangle pattern to below for the local downtrend as the secondary correction to be continuing.
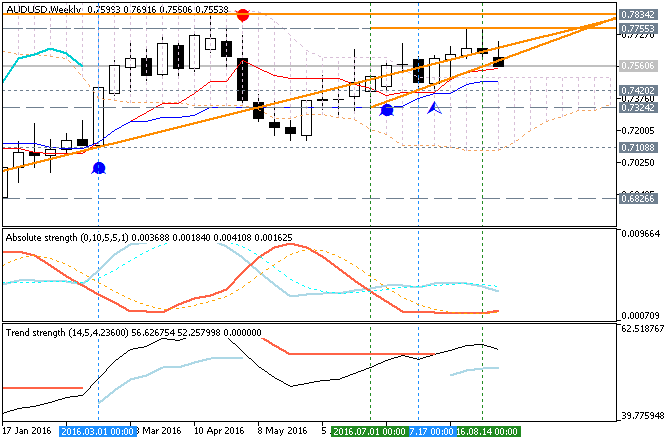
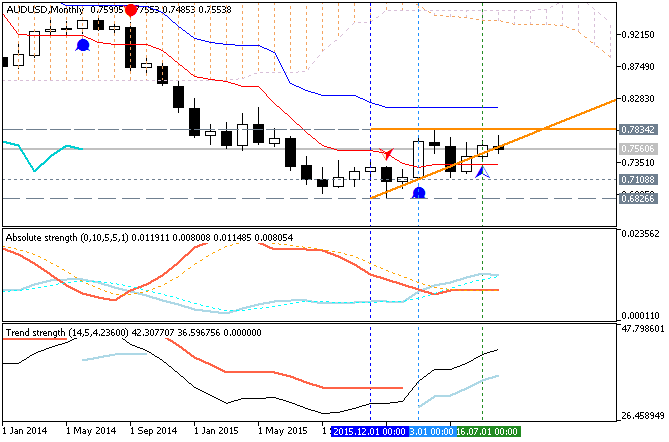
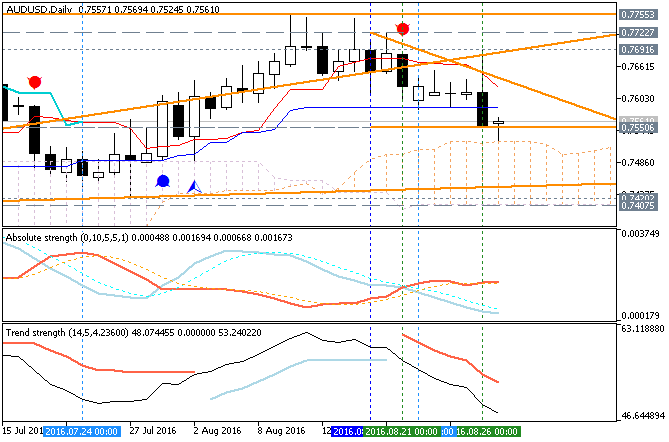
- Chinkou Span line of Ichimoku indicator is located above Ichimoku cloud indicating the future possible breakdown to be started in the near future.
- Trend Strength indicator and Absolute Strength indicator are estimating the trend as the correctional one.
The
bearish reversal level is 0.7420 support, and if the price breaks this
level to below so the bearish reversal will be started.
If D1 price breaks 0.7420 support level on close bar so the reversal of the daily price movement from the bullish to the primary bearish market condition will be started.
If D1 price breaks 0.7755 resistance level on close bar from below to above so the bullish trend will be resumed.
If not so the price will be on bullish ranging within the levels.
- Recommendation for long: watch close D1 price to break 0.7755 for possible buy trade
- Recommendation
to go short: watch D1 price to break 0.7420 support level for possible sell trade
- Trading Summary: correction
| Resistance | Support |
|---|---|
| 0.7690 | 0.7583 |
| 0.7755 | 0.7420 |
SUMMARY : bullish