Technical Analysis of Gold for April 11, 2016
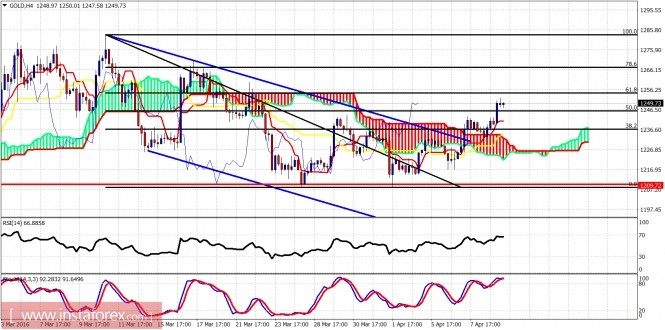
Gold has broken upwards above the short-term bearish channel and above the short-term resistance at $1,145-50 giving a bullish signal. However, bulls need to be very cautious despite the small chances of making a new higher high towards $1,300. Overbought oscillators give a warning.

Blue lines - bearish channel (broken)
Red line - critical support
Gold has broken above the bearish channel and the 4-hour Kumo (cloud) resistance. The price is in a short-term bullish trend after successfully back-testing support at $1,233. The next important short-term resistance is at the 61.8% Fibonacci retracement at $1,254. Support is at $1,233.

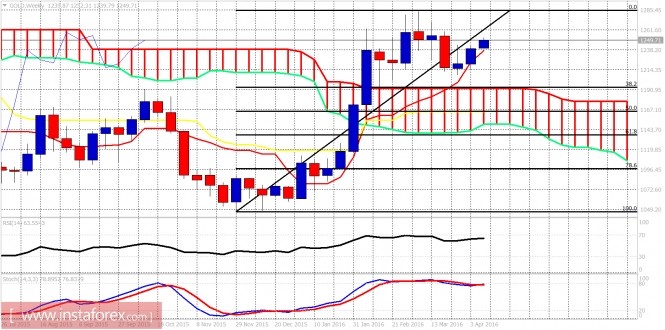
The weekly candle of last week held above the tenkan-sen (red line indicator) and the price remains above it right now making higher highs. We might see a new high towards $1,300 but oscillators are showing bearish divergence signals. These signals are a warning for bulls to be very cautious. If the price reverses and breaks below $1,230, it is "game over" for bulls as the price will be expected to move fast towards $1,190. If support is held and the price breaks above $1,255-60 for a daily close, we should expect a move to $1,300-$1,320 to follow.
The material has been provided by InstaForex Company - www.instaforex.com


