Analytical Review of the Stocks of Facebook Inc.
Facebook Inc., #FB [NASD]
Technologies, Internet service providers, USA
Financial performance of the company:
Index – S&P 500;
Beta – 0.73;
Capitalization – 327.58 В;
Return on asset – 8.10%;
Income – 5.87 В;
Average volume – 29.17 М.
P/E – 89.22.
ATR – 4.09.
Analytical review:
- Since the beginning of February the company’s shares has grown by over 13%. It is expected that the rise in quotes will continue.
- The company ranks the second on capitalization in the sector “internet providers” among the issuers traded in the American stock market.
- At the end of January the company reported for Q4 of the fiscal year 2015. According to the press-release of the company revenue of Facebook increased by 50% and amounted to 5.8 billion USD. Within a year EPS rose by 17.2%, fromс 1.10 USD to 1.29 USD.
- In 2014 the company acquired WhatsApp application for 22 billion USD. This year the number of users of this application has reached 1 billion per month. Lat quarter the company’s revenue grew due to sales of ads on the mobile devices. Currently, WhatsAp service is not monetized. In future this application will allow the company to generate additional revenue from the sales of ads.
- The company signed a contract with the Eutelsat about launching a satellite, which will provide access to internet in 14 African countries. The company expects the launch of the service in the 2nd half of 2016.
- Most of the largest investment funds and banks (Stifel, RBC Capital, Argus) predict the rise of stock price up to USD 125-130.
Summary:
- The last company’s report showed that management of the company is on the right track. The company has potential for development and diversification of its business. The largest part of the company’s revenue is generated with the help of advertisement on the mobile devises. The market is growing annually at the fast pace. Large investment funds expect positive dynamics of the company’s stocks.
- It is likely that in the near future company’s quotes will go up.
Trading tips for CFD of Facebook Inc.
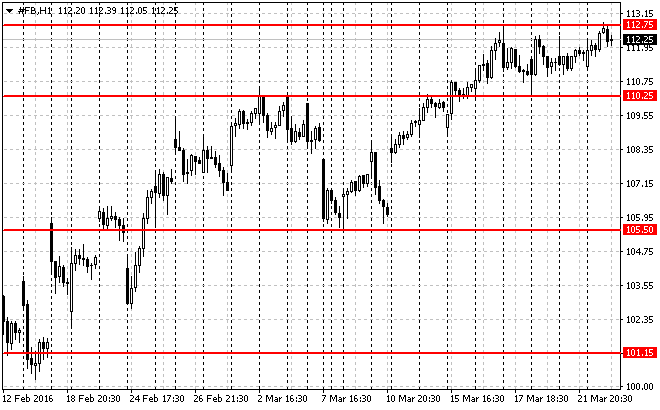
Medium-term trading: the moment the issuer is traded in the range of 110.25-112.75 USD. After breaking out and testing of resistance level of 112.75 USD and in case of the respective confirmation (such as pattern Price Action), we recommend to open long positions. Risk per trade is not more than 2% of the capital. Stop order can be placed slightly below the signal line. Take profit can be placed in parts at the levels of 116.50 USD, 119.00 USD and 122.00 USD with the use of trailing stop.

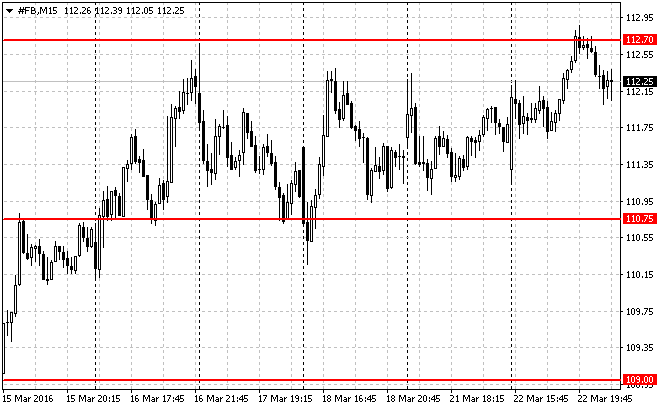
Short-term trading: on the chart with the timeframe 15M the issuer is traded between the local support and resistance levels of 110.75 - 112.70 USD. We will recommend to enter the market after breakout and testing of these levels. Positions can be opened at the signal line and the nearest support/resistance level. Risk per trade is not more than 3% of capital. Stop order can be placed slightly above/below the signal line. Take profit can be placed in parts of 50%, 30% and 20% with the use of trailing stop.

The material has been provided by LiteForex - Finance Services Company - www.liteforex.com


