

I would be elaborating on how to use the PIVOT POINTS as a trading strategy and in this article I will discuss.
- What are Pivot Points
- Variants of Pivot Points
- Limitations of Pivot points
In the article I will discuss about how to choose entry level, take profit and exit strategy with a lot of live examples with the help of charts and my trades in contest. Now let’s unerstand…
What are pivot points
Pivot points are technical analysis indicator are used to identify the trend of the market over different time frames. They are one of the oldest technical tools used by floor traders. It is pretty easy to compute and would give the traders some idea about how the market moves and to determine the reversal of the trend. It’s been calculated using the previous time frame’s OPEN, HIGH, LOW and CLOSE. This was originally used for the intraday trades but may be calculated for 1 minute and upto 1 month too. However most of the time traders use it for intraday trading purpose and use weekly pivot for setting the trend, but people also watch the weekly, monthly and also yearly levels for determining the longer period trend.
In a nut shell, it’s that average of previous time period’s High, Low
and Close. If the price of a pair is trading above the pivot point,
it’s considered to be BULLISH sentiment and if the price of a pair is
trading below the pivot point, it’s considered to be BEARISH.
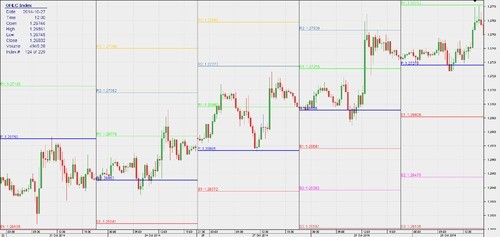
Pivot points consist mainly of 7 trading levels. The midpoint of previous day’s high, low and close is called PIVOT POINT. The levels above the pivot points are called Resistance ‘R’ and below are called Support or ‘S’. There are three resistance and three support levels, Viz R1, R2 and R3 for resistance and S1, S2 and S3 for support zones.
Variants of pivot points
There are three famous variants in pivot viz,
Classic Pivot Points: In classic pivot points high, low and close of the previous time frame are taken in to consideration and the average of high low and close is the pivot point. I will be discussing about trading using classic pivot points in later part of the series.
Woodie Pivot Points: Woodie pivot not only takes in to
account the previous time frame’s high, low and close, but also
considers the current day’s open and the average of the 4 levels are the
pivot points. Since the Forex market trades round the clock we see the
open and close be the same most of the times and generally not favoured
by the traders in Forex.
Camarilla Pivot Points: Camarilla pivot points were
discovered in 1989 by Nick Scott. In this the trader looks at break outs
rather than looking at the pivots and resistance or support. In this
pivot, the third and fourth levels are important and the resistance
levels are called H1,2,3,4 and support levels are called L1,2,3,4. The
trader usually looks at shorting at H3 with stop and reverse above H4
with a target of H1,2 and 3. Similarly, traders will look at buying
around L3 with stop and reverse below H4 with a target of L2,1 pivot
etc.
Well, I don’t bother you by explaining the calculations of the aforesaid variants as most of today’s trading platforms offer them. You may find the same pivots in platform JForex under add indicator symbolically F(x) and under “Overlap Studies” you will find all the above indicators.
Limitations of Pivot Points
Before even starting the discussion about how to trade using pivot points I would like to let you know the limitations or weakness of pivot points.
- Even though pivot points is one of the oldest tool in trading there are other things we need to understand before entering the trades such as the fundamental/economic news expected and the expected impact on the currency pair. Technical analysis fails against fundamental reason.
- Chart patterns, previous day’s lows and highs, day’s opening prices will also act as strong support and resistance levels which need to be taken in to consideration before entering trades.
- One should also study the bigger trend and use the pivots levels to entry than just using these levels as a text book entry and exit. For e.g. If the trend in hourly and 4 hour chart for day trading is bullish it’s better to enter long positions above resistances also than to use it to short.
- Candle pattern analysis is very important in Forex trading. One must watch the higher time frame of 1 hour and 4 hour chart pattern even when using pivot points for intraday trading.
- Since pivot points are based on previous day’s range, these have failed in the past when there is a huge movement due to economic data or political reason or flat market due to holidays. When there is a huge movement in the previous day, the pivot, resistance and support zones tend to be too far and may fail to reach them and when the movement is low, the pivot, resistance and support zones will be too narrow which may not be profitable to trade.
- Pivot points are short-term trend indicators which are useful for only for the time frame set and it needs to be recalculated again for the next time frame.
- Forex being a round the clock market with no proper opening and closing hours specified, is difficult to set the time. While many consider closing of New York market hours some consider GMT as the closing. There is a difference of 2 hour between those times and in my examples I set the New York time zone as closing.
- Being mostly used as intraday trading tool, traders can’t aim hundreds of PIPs take profit and also shouldn’t use bigger stop losses. However by fine tuning this tool, it can be used for positional trades which I will be discussing in the next article.
In the next article I shall discuss how to place orders, entry and exit strategy for day trading, trading based on break outs, pull backs, consolidations, etc.
Till then, happy trading……….


