

3
1 097
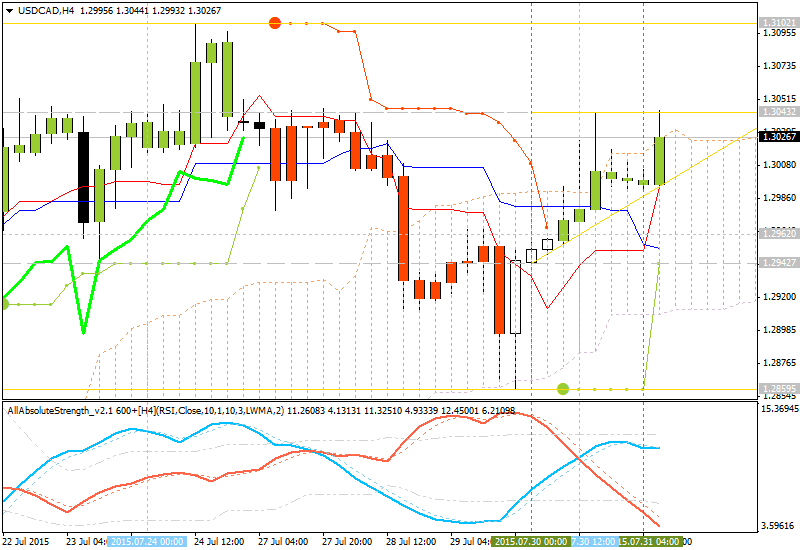
H4 price
is breaking Senkou Span A line (which is the virtual border between the primary bullish and the
primary
bearish on the chart) from below to above for trying to cross 1.3043 resistance level for bullish reversal.
- Chinkou Span line is breaking the price from below to above for good breakout of the price movement in the near future.
- The price is crossing Ichimoku cloud/kumo and Senkou Span A line together with 1.3043 resistance level for reversal to the bullish area of the chart.
- The nearest support levels for H4 price are 1.2942 and 1.2859.
- The nearest resistance levels for H4 price are 1.3043 and 1.3102.
| Resistance | Support |
|---|---|
| 1.3043 | 1.2942 |
| 1.3102 | 1.2859 |
If
H4 price will break 1.2942 support level on close H4 bar so the primary bearish will be continuing.
If H4 price will break 1.3043 resistance level so we may see the reversal to the primary bullish
condition.
If not so we may see the ranging market condition within the levels.
- Recommendation for long: watch close H4 price to break 1.3043 for possible buy trade
- Recommendation
to go short: watch H4 price to break 1.2942 support level for possible sell trade
- Trading Summary: ranging
SUMMARY : ranging


