EURUSD Technical Analysis 2015, 28.06 - 05.07: Descending Triangle for breakdown

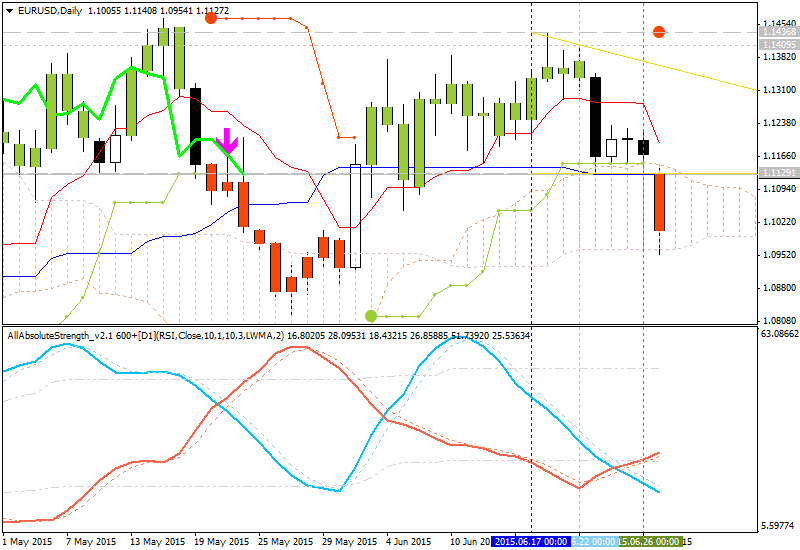
Daily price was on ranging bullish movement with secondary correction: the price was stopped above 1.1129 key support level near 'reversal' Senkou Span A line which the border between primary bullish and the primary bearish on the chart. The price formed descending triangle with 1.1129 key strong support level located to be above Ichimoku cloud and very near Senkou Span A line. Chinkou Span line is estimating the future possible breakdown of the price movement from the primary bullish to the bearish area of the chart. If the price breaks Descending Triangle with 1.1129 so the price will be inside Ichimoku cloud and we may see the reversal to the bearish with secondary ranging market condition.
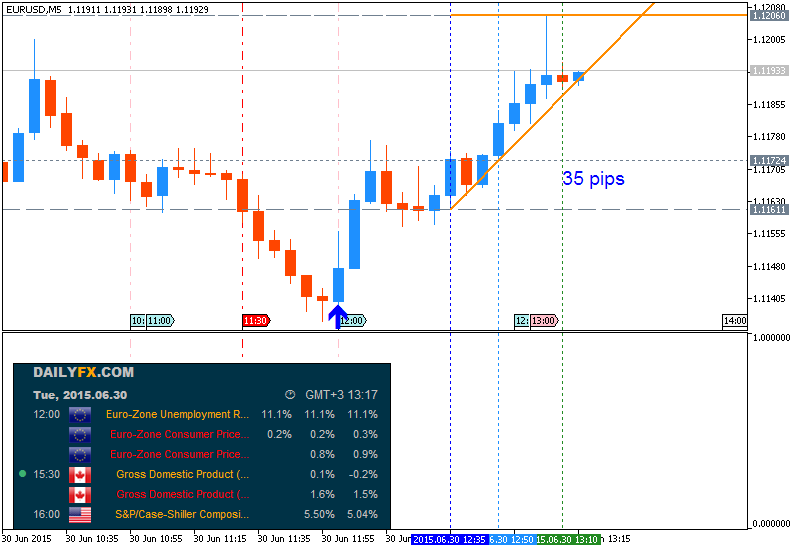
Daily bar was opened below 1.1129 support level for today so the bearish breakdown is started.
D1 price - secondary correction within the primary bullish - ready to reversal:
- Tenkan-sen line is located to be above Kijun-sen line of Ichimoku indicator for the primary bullish market condition on D1 timeframe.
- Chinkou Span line is estimating the possible breakdown by direction.
- 'Reversal' Senkou Span A line as the border between primary bullish and the primary bearish on the chart is located near the price for possible reversal to the primary bearish market condition on this week.
- AbsoluteStrength indicator is estimating the local downtrend as a secondary correction to be continuing.
- Nearest key support level is 1.1129 (D1).
- Nearest resistance level is 1.1436 (D1).
W1 price
is on bearish market condition with secondary ranging between 1.0818
(W1) support level and 1.1466 (W1) resistance level.
MN price
is on ranging bearish with 1.0461 support level.
D1 price broke 1.1129
support level on close D1 bar so the price was fully reversed to the primary bearish market condition.
If D1 price will break 1.1436 resistance level so the bullish trend will be continuing with possible good breakout.
If not so the price will be on ranging between 1.1129 and 1.1436 levels.
| Resistance | Support |
|---|---|
| 1.1436 (D1) | 1.1129 (D1) |
| 1.1466 (W1) | 1.0818 (W1) |
| 1.2886 (MN1) | 1.0461 (MN1) |
TREND : reversal to ranging bearish