One of the most difficult things in forex trading is knowing the action of the price reversal. In fact a great many technical analysis tools to help identification, but more widely used is a candlestick. Candlestick used as the first clue in identifying the market.
Learn and understand the candlestick patterns is a great way to start trading analysis, because the candle itself is a direct interpretation of price action. This article will discuss how to focus on trading in the market by relying on the most obvious reversal signals using pattern bullish morning star.
What is a bullish morning star pattern?
A bullish morning star pattern is a pattern of candle formed in the end of a long downtrend. Pattern is a bullish morning star pictured like a candle on top. It should be noted that a bullish morning star consists of three different candle.
First candle should illustrate the continuation of the downtrend. The second candle will show a slowing of momentum is bearish. Here, the price will make one last movement on the lower level with the closing candle near the opening price. Candle and doji hammer was found often in this position.
The third candle in a bullish morning star pattern is an actual reversal signal. A blue candle that is depicted on the above graph should appear to be in a position to start a new swing in momentum bullish. Should ideally be a bullish engulfing candle with the previous candle high above. A strong surge in prices illustrate the pressure to buy. The greater decrease secondary making candle pricing is considered to have a strong reversal signal.
Use in Commerce
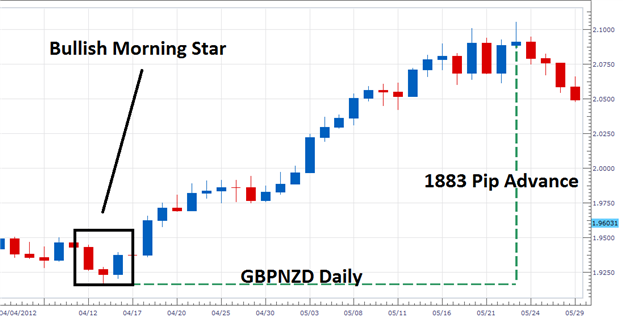
The most important thing about a bullish morning star is the fact that once you can identify it, you can immediately implement in your trading. In the chart above you can see patterns in action on the daily chart GBPNZD. From April 13 to May 24 in one year GBPNZD rally as much as 1,907 pips. The rally was preceded by a bullish morning star which gives the first opportunity to consider the reversal of the trend and establish opportunities to buy.
Traders often choose to use a breakout strategy in today's market there is a reversal. The first candle in the scenario of the pattern can be used as a resistance area. Buy action command entries can be set at the time the couple began to penetrate the resistant higher.
https://www.mql5.com/en/signals/author/hermanfendy
https://www.mql5.com/en/market/product/5481
https://www.mql5.com/en/market/product/5480
https://www.mql5.com/en/market/product/893
Not infrequently this analysis using the trader with the oscillator. Market orders can be placed in the direction of the new trend when indicators such as RSI shows the momentum back from oversold levels. Whatever method is selected, the trader should consider placing stop order under low second candle. If there is a failure in the reversal of the price, the trader can buy out of the transaction at any time.


