 Technical Analysis 2015, 31.05 - 07.06: ranging after bearish breakdown with 1132.00 psy support level")
GOLD (XAU/USD) Technical Analysis 2015, 31.05 - 07.06: ranging after bearish breakdown with 1132.00 psy support level

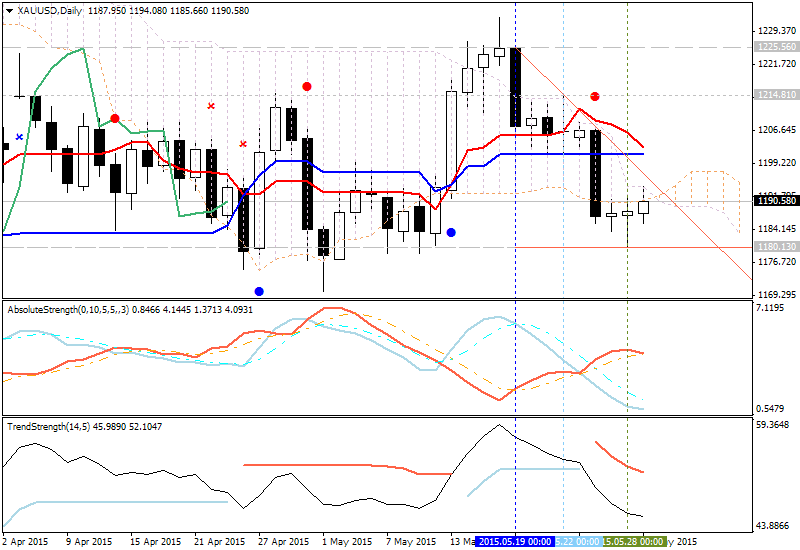
Daily price was on good breakdown for the last week: the price broke
key support levels incl Ichimoku cloud and came to the primary bearish
zone on this timeframe. D1 price was stopped by 1180.13 support level near 'reversal' Senkou Span A line on the way to downtrend.
If
the price will cross 1180.13 support level so breakdown within the
primary bearish will be continuing, otherwise we will see the price to
be reversed back to the bullish zone with secondary ranging between the
levels.
- Tenkan-sen line is ready to cross with with Kijun-sen line from above to below for the breakdown to be continuing within the primary bearish condition on D1.
- Chinkou Span line is located near the price and ready to cross it on any direction: from above to below for the bearish trend to be continuibng, or from below to above to reversed the price back to the bullish zone.
- 'Reversal'
Senkou Span A line as the border between primary bullish and the
primary bearish on the chart is located above and very close the price
for possible reversal it back to the bullish on this week.
- Nearest support level is 1180.13 (D1)
- Nearest resistance level is 1214.81 (D1)
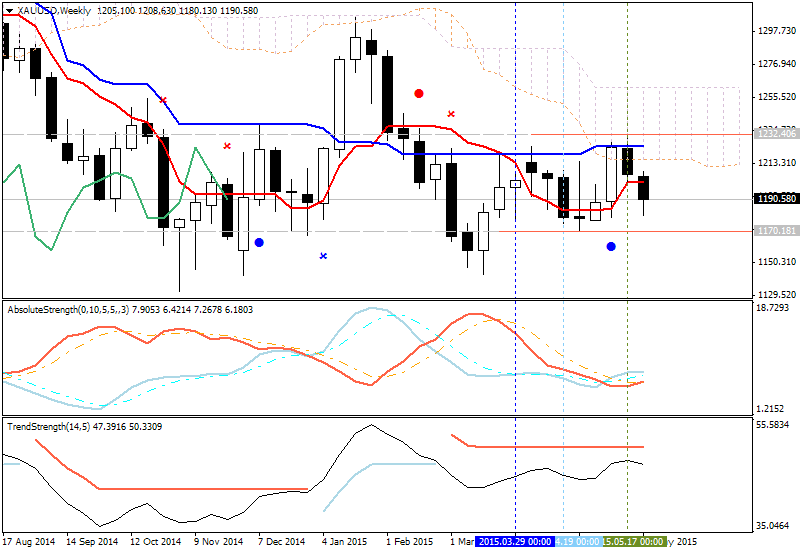
W1 price
is on bearish breakdown which was started on open W1 bar for now: the price was ranging between 1170.18 support and
1232.40 resistance since the beginning of March this year, and breakdown
is started on open W1 bar for the price for trying to break 1170.18 support level.
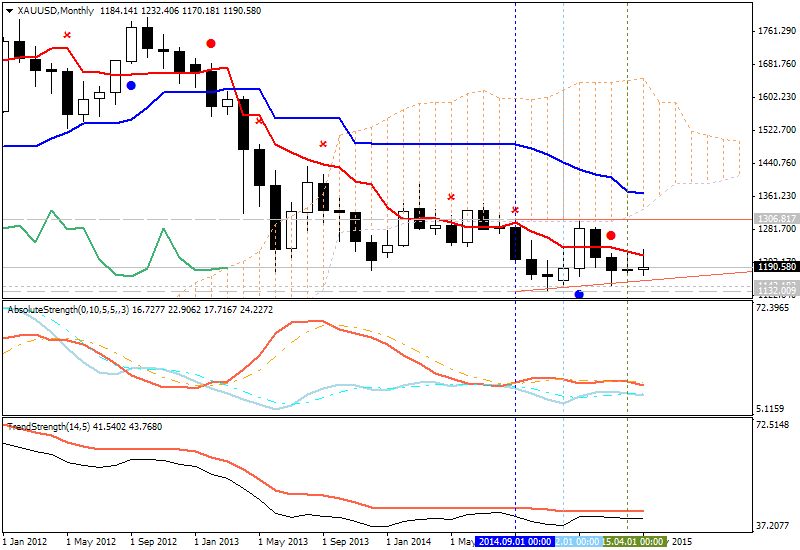
MN price
is on ranging bearish with 1132.00 support level
If D1 price will break 1180.13
support level on close D1 bar so we may see the primary bearish with secondary breakdown.
If D1 price will break 1225.56 resistance level so the bullish trend will be continuing
If not so the price will be on bullish ranging between 1180.13 and 1214.81 levels
- Recommendation for long: N/A
- Recommendation to go short: watch D1 price to break 1180.13 support level for possible sell trade
- Trading Summary: ranging
| Resistance | Support |
|---|---|
| 1225.56 (D1) | 1180.13 (D1) |
| 1232.40 (W1) | 1170.18 (W1) |
| 1306.81 (MN1) | 1132.00 (MN1) |
SUMMARY : bearish
TREND : ranging


