
Technical Analysis for US Dollar, S&P 500, Gold and Crude Oil - Still Waiting for Direction

US DOLLAR TECHNICAL ANALYSIS
rices accelerated upward,
advancing to the highest level in three weeks. Near-term resistance is
at 11898, the 50% Fibonacci retracement, with a break above that on a
daily closing basis exposing the 61.8% level at 11960.
S&P 500 TECHNICAL ANALYSIS
Prices are consolidating after
breaking range resistance and setting a new record high. From here, a
daily close above the 50% Fibonacci expansion at 2140.70 exposes the
61.8% level at 2159.30.
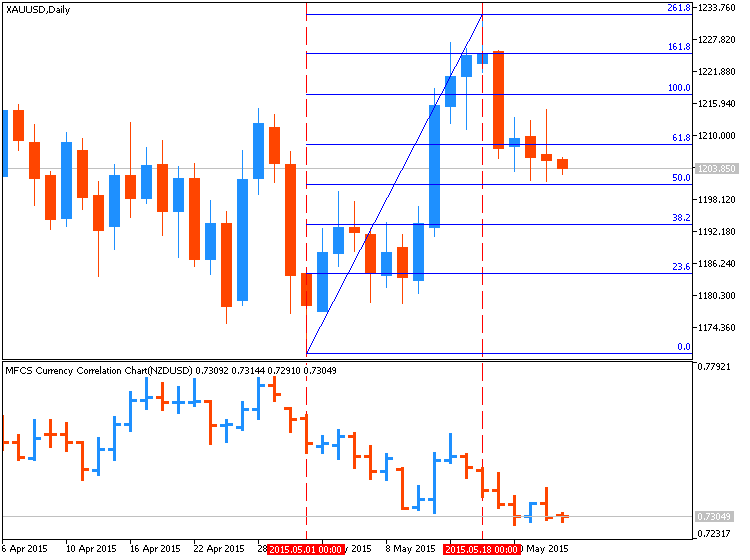
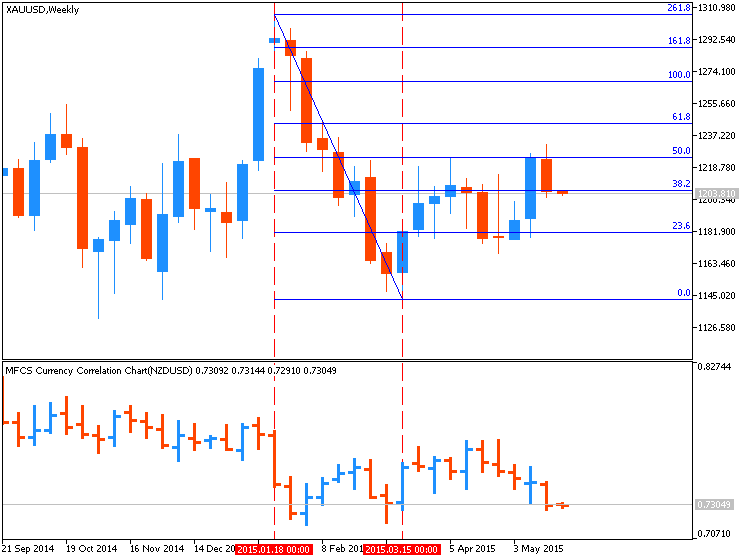
GOLD TECHNICAL ANALYSISPrices continue to consolidate after recoiling from resistance below $1250.oz. A close below trend line resistance-turned-support at 1204.19 exposes the 23.6% Fibonacci expansion at 1193.38. Near-term resistance is at 1232.30, the May 18 high.
CRUDE OIL TECHNICAL ANALYSIS
Prices remain locked in a choppy
consolidation range below the $70/barrel figure. A daily close below the
23.6% Fibonacci retracement exposes the 38.2% level at 60.27.
Alternatively, a move above trend line resistance at 67.68 targets the
23.6% Fib expansion at 69.70.


