Technical Analysis for EURUSD, GBPUSD, AUDUSD, NZDUSD, USDJPY, USDCAD, USDCHF
16 February 2015, 06:11

5
544
EURUSD
Weekly
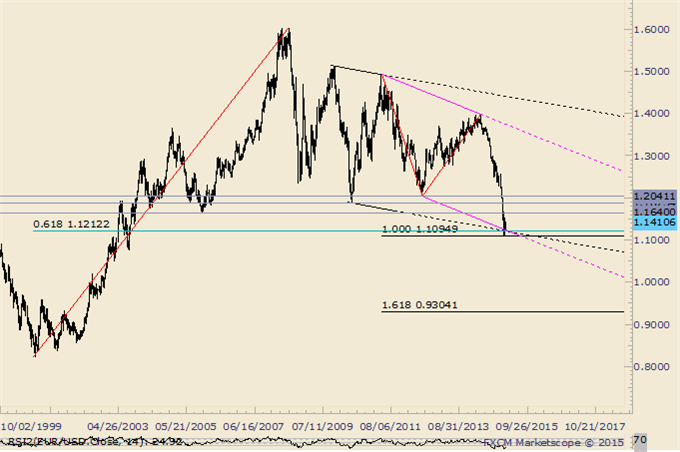
- “BIG picture, monthly RSI has broken out of a triangle pattern. Sometimes, a pattern breakout in momentum (or OBV) precedes the breakout in price. The development’s implications are obviously significant.”
- A number of calls for parity have been published recently. While the
long term pattern suggests an eventual print near .90, the sudden
aggressively bearish calls come just after a record small speculator
short position and record open interest in euro futures was recorded in
November. The same COT profile was evident in May 2012, before the
EURUSD bottomed in July. Aggressive forecasts are often published when
it’s comfortable to do so, which means that the trend is embedded in the
public consciousness to the point of extremity. The path to .90 or so
won’t be smooth (in other words…more 2 way trade). Former support may
provide resistance from 1.1640 to 1.2040.
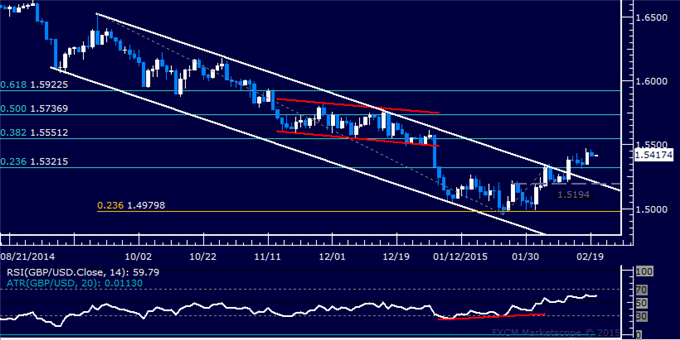
GBPUSD
Weekly
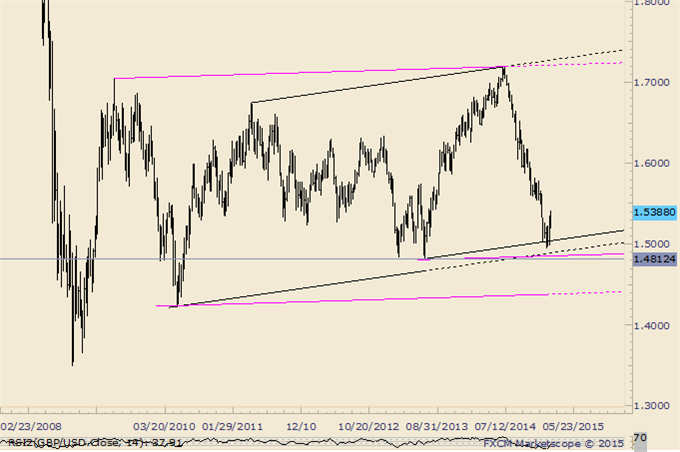
- GBPUSD has turned up from slope support on the weekly and a breakout
from a 1 month inverse head and shoulders pattern is valid above 1.5195
low. The reversal pattern’s objective is 1.5494, which is in line with
the December low at 1.5485.
AUDUSD
Weekly
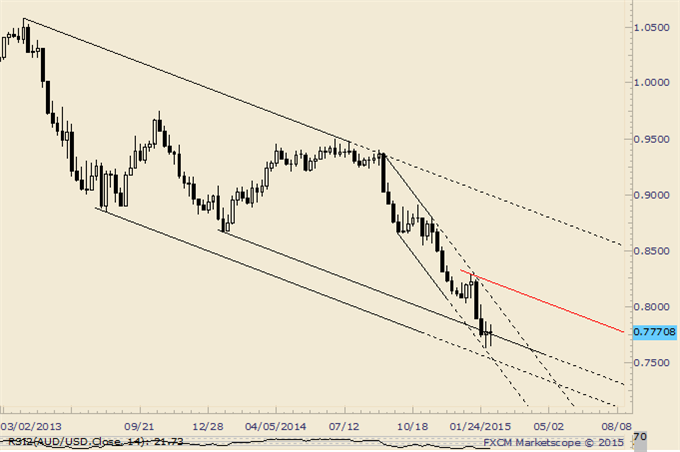
- “AUDUSD may be trying to put in a floor of sorts as the rate has held up since putting in a large range and volume reversal on Tuesday. The larger trend remains lower however with resistance estimated at .8030/50. The next potentially important support probably isn’t until the 61.8% retracement of the 2001-2011 rally at .7183.”
-
The last 2 weekly candles (key reversal and inside doji), at slope
support mind you, are consistent with a near term change in behavior.
NZDUSD
Weekly
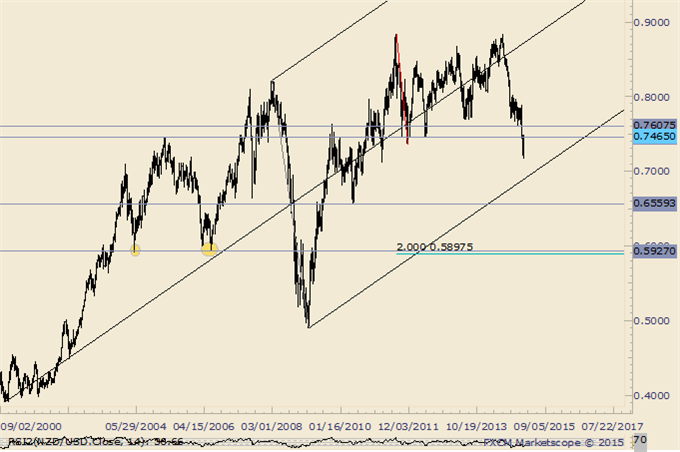
- “NZDUSD traded to the 61.8% retracement of its 3 year range today (.7929) and the next level of interest probably isn’t until the 2013 Labor Day gap at .7722. One can’t help but notice that an epic double top is possible with a target of .5898. That would trigger on a drop below .7370.”
- The large double top triggered so watch for resistance near .7530/50 now.
USDJPY
Weekly
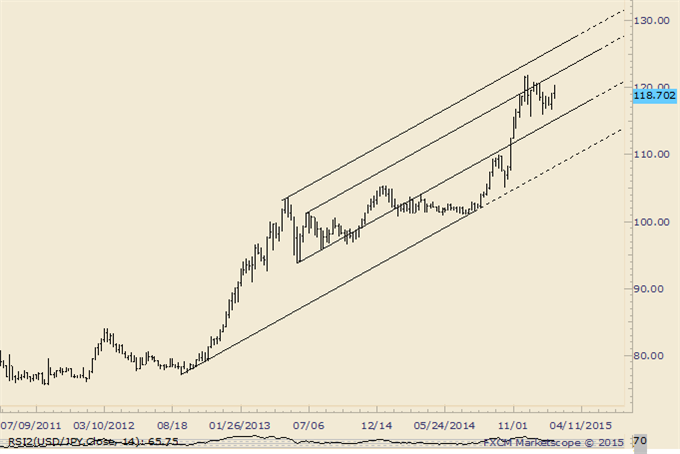
- Continue to favor a broad range as 119.80-120.70 as resistance and
116.40-117.10 as support. A move through either one of these zones would
usher in larger move towards 124-128 or 110-114.
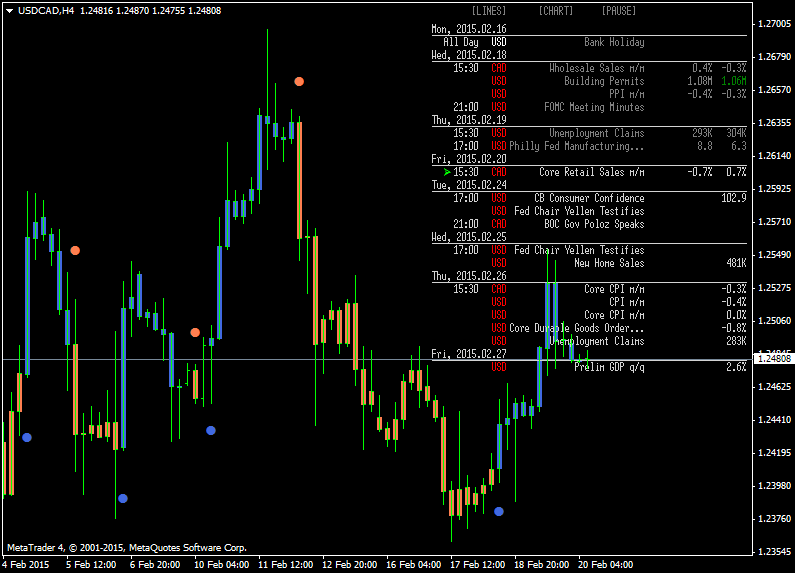
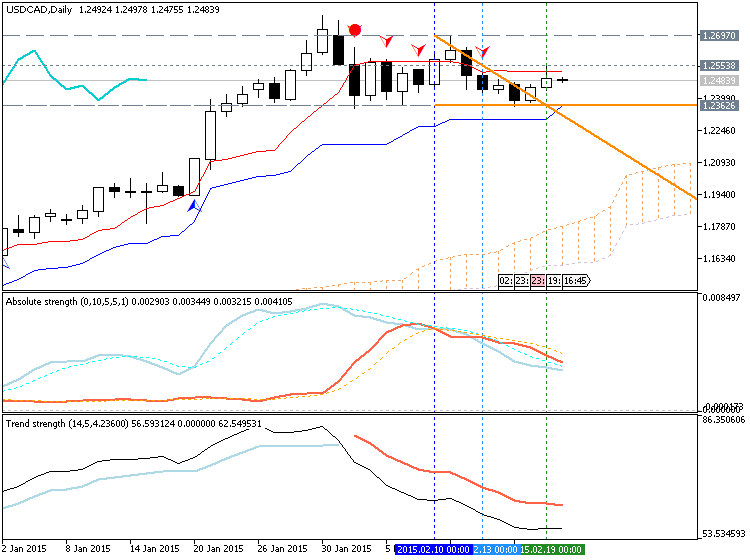
USDCAD
Weekly
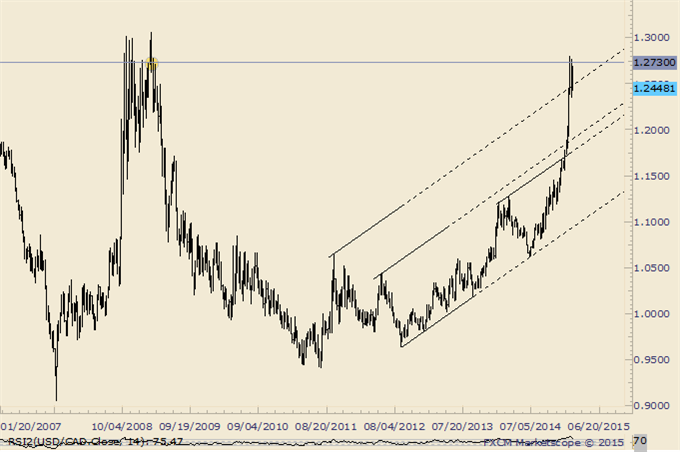
- “USDCAD has pushed through the 2007 high at 1.1875, 61.8% extension of the 2007-2009 rally from the 2011 low at 1.1882, and several upward sloping parallels. The next cluster of technical levels is between 1.25 and 1.2730.”
- USDCAD nearly traded 1.28 on January 30th (the rate put in a top last
year on the 31st) and has since retraced everything since 1/23. 1.2180
(38.2% of rally from November low) may provide important support for
another rally attempt.
USDCHF
Weekly
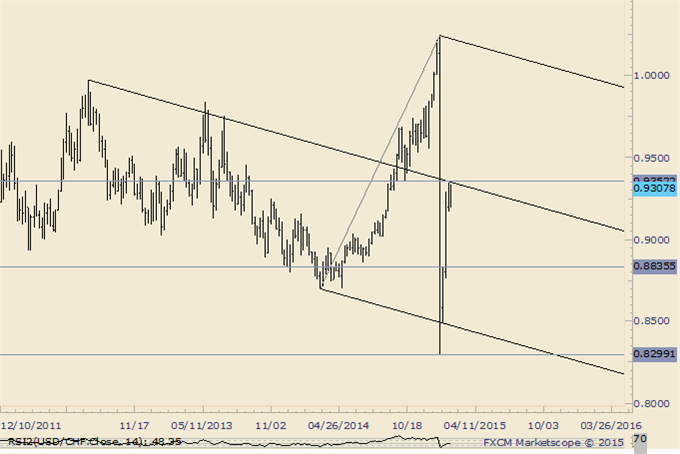
- Since banging off of a lower parallel (after SNB), USDCHF has rallied and is just pips from the median line of that structure. The line in question is just pips from the October 2014 low at .9352. Watch for resistance. A reaction targets .8820/30 as support. A move over the mentioned median line opens up .9530/50 (November and December 2014 lows).