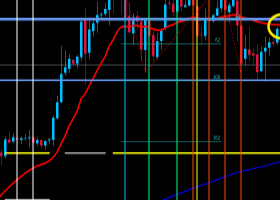
Hi Traders, we had a trade on USDCAD H1 time-frame that today 04 April 23 the market already moved +1600 points of profit after the red candle and the volume confirmations appeared...
EURAUD: Bearish Outlook 🔻EURAUD is trading on a key weekly structure resistance. Once the underlined area was reached, the pair started to trade within a horizontal range for 9 consequent trading days. Its support was finally broken yesterday. I think that the pair may drop now. Targets: 1...
#NZDUSD: Bullish Setup Explained 🟢NZDUSD reached a solid horizontal support. The price was steadily falling within a bullish flag pattern . Once the underlined structure was reached, the market bounced and broke the resistance of the flag. I believe the pair will go higher now. Goals: 0.6267 / 0...
Crude Oil (#WTI): Have You Seen That GAP? 🛢 With a sudden OPEC decision to cut oil production rate, 🔻WTI Oil opened with a huge gap up. The price is currently testing a solid horizontal supply cluster. What we know about gaps is the fact that in 80% of the time they tend to be filled...
S&P500 Index (#SPY): Bullish Outlook Explained 🟢S&P500 Index is trading in a rising channel on a daily. The price was approaching a solid resistance cluster on Thursday and Friday. The market managed to break that and successfully closed above...
#GBPUSD: Your Detailed Trading Plan For This Week ⚠️GBPUSD is approaching a key daily structure resistance. The price is currently stuck with a rising wedge pattern . To catch a bearish move from that, watch a reaction of the price to the support of the wedge...
#AUDNZD: Waiting For Breakout ⚠️AUDNZD is trading in a bearish trend. The price is currently accumulating within a descending triangle formation. 1.067 - 1.069 is its neckline. If the price breaks and closes below that on a daily, probabilities will be high that the market will drop lower...
Parameters description and demo files: RSI Divergence Scanner MACD Divergence Scanner How to get the most from MACD|RSI divergence scanners Divergence indicators show when trend is weakening and helps you to being aware of possible ending of a trend, so you can use them to find trend reversals fo...
EUR/USD: Why the Dollar Fell ● Last week passed without sharp jumps. The dollar continued to fall in price, and EUR/USD returned by March 30 to where it was traded seven days before. The local maximum was fixed at 1.0925, and the five-day period finished at 1.0842...
WHAT A MONTH! The 4 main strategies with the Market Reversal Alerts EA bagged a whopping 66.86% profit combined during March. All the strategies are available here for the EA and you can run different variations to suit your needs...
Hello traders, I placed three trades today. A short setup on USDJPY M30, a short setup on EURUSD M30 and a short setup on EURCHF H1. I had 2 winners and 1 looser. Price on EURUSD was over-extended and had touched a nested Supply Zone...
#USDCAD: Time For Pullback 🟢USDCAD reached a key level. Testing that, the price broke and closed above the resistance line of a falling wedge pattern . I expect a pullback now. Goals: 1.355 / 1.3577 Consider these structures for pullback/breakout trading...
Market Breakdown | GOLD, USDJPY, SILVER, US30 Here are the updates & outlook for multiple instruments in my watchlist. Gold (#XAUUSD) 4h time frame 🟡 Gold is perfectly respecting a minor rising trend line . So far, I would expect a bullish continuation from that...
#NZDCAD: Classic Bearish Pattern 🔻NZDCAD formed a head & shoulders pattern on a daily time frame. Its neckline was successfully broken yesterday. I expect a further decline on the pair. Targets: 0.84 / 0.837 Contact information: Profile: https://www.mql5...
BITCOIN (#BTCUSD): Waiting For The Next Move ₿ ⚠️Bitcoin is consolidating after a sharp bullish rally. The price is coiling within a horizontal trading range on a daily. Depending on the reaction of the price to its boundaries, I see 2 potential scenarios...
#EURJPY: Detailed Structure Analysis Here are my latest structure analysis for ⚠️EURJPY. Support 1: 138.80 - 139.25 area Support 2: 137.38 - 138.18 area Resistance 1: 143.19 - 143.6 area Resistance 2: 145.00 - 145.58 area Resistance 3: 146.40 - 146...
#USDCAD: Important Breakout 🔻USDCAD broke and closed below a solid horizontal demand cluster on a daily. The broken structure turned into resistance now. Probabilities will be high to see a bearish move from that. The goals will be 1.356 / 1...
Dollar Index (#DXY): Key Levels to Watch This Week 💵 Here is my latest structure for 🔻 Dollar Index . Resistance 1: 103.11 - 103.63 area Resistance 2: 104.74 - 105.1 area Resistance 3: 105.667 - 105.88 area Support 1: 100.82 - 100.88 area Consider these structures for pullback/breakout trading...
Many traders use The Bull-Bear Indicator, I decided to combine the two into just one, so the visualization is better, and I am sharing it with you. the trading rules remain the same, you can adjust the period as per your preference...


