
Step on New Rails: Custom Indicators in MQL5

Introduction
Finally we've got an opportunity to try the new trade terminal - MetaTrader 5. No doubt, it is noteworthy and has many new features as compared to its predecessor. The important advantages of this platform among others are:
- Essentially modified language allowing now to use the object-oriented programming, still allowing to use the rich advantages of structural programming.
- The code execution speed, which now is much faster than in MetaTrader 4.
- Essential increase of possibilities for displaying the necessary information.
I will not list all of the new possibilities and features of the new terminal and language. They are numerous, and some novelties are worth the discussion in a separate article. Also there is no code here, written with object-oriented programming, it is a too serous topic to be simply mentioned in a context as additional advantages for developers.
In this article we will consider indicators, their structure, drawing, types and their programming details, comparing to MQL4.
There is nothing complicated in this article, moreover, anything of the considered here can be checked directly in the terminal using the attached files.
I hope that this article will be useful both for beginners and experienced developers, maybe some of them will find something new here.
The General Structure
The general structure of the indicator as compared to MQL4 hasn't changed.
As before, there are three functions - for initialization, for data processing, and for the indicator deinitailization.
As before, many indicator parameters can be defined by properties (#property keyword). The most of them are designed specifically for indicators. Properties and input parameters as before, are defined in a global context.
As example, let's consider the implementation of the custom coloring for RSI indicator. Here is the truncated version, the full one can be found in the file Color_RSI.mq5.
Let's consider the parts of the code.
//--- group of data properties
#property copyright "TheXpert"
#property link      "theforexpert@gmail.com"
#property version   "1.00"
//--- description of the indicator should not exceed 511 symbols in total
//--- including newline symbols
#property description "      "
#property description "Demonstration of the indicator creation"
#property description "by the example of RSI coloring"
The properties specified above are displayed in the indicator information panel (the "Common" tab of the properties). It looks like:

//--- indicator properties
#property indicator_separate_window // the indicator will be displayed in a separate subwindow
#property indicator_buffers 2       // number of used buffers
#property indicator_plots   1       // number of displayed buffers
//--- plot 1
#property indicator_color1 clrDarkSalmon, clrDeepSkyBlue // use 2 colors
#property indicator_type1  DRAW_COLOR_LINE               // and the special color display type
These properties are the indicator properties. The other properties description can be found in the help.
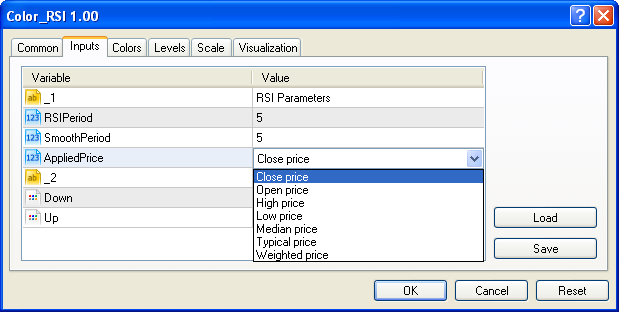
//---- buffers
double Values[];                 // buffer of values
double ValuesPainting[];         // buffer of color indices
//--- indicator input parameters
input string             _1           = "RSI parameters";
input int                RSIPeriod    = 5;
input int                SmoothPeriod = 5;
input ENUM_APPLIED_PRICE AppliedPrice = PRICE_CLOSE;
input string             _2           = "Color settings";
input color              Down         = clrDarkSalmon;
input color              Up           = clrDeepSkyBlue;
//--- variable for storing the indicator handle
int RSIHandle;
Here are the indicator input parameters and global variables (do not confuse with global variables of the client terminal). The indicator input parameters are specified with the input identifier.
Now it is possible to set enumeration for the input parameter, sometimes it is useful to avoid the incorrect parameters selection.
For example, the AppliedPrice parameter will be displayed in a drop-down list with possible valid values.
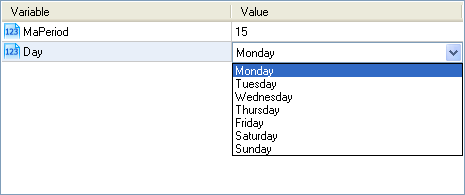
So all of the enumerations, including the user defined, will be displayed in the same drop-down list. For example, the following parameter
//...
enum DayOfWeek
{
    Monday,
    Tuesday,
    Wednesday,
    Thursday,
    Friday,
    Saturday,
    Sunday
};

input DayOfWeek Day;

//...
will be displayed as follows:
int OnInit()
  {
//--- bind indicator buffers
//--- Values serves as a display buffer
   SetIndexBuffer(0,Values,INDICATOR_DATA);
//--- ValuesPainting serves as the buffer for storing colors
   SetIndexBuffer(1,ValuesPainting,INDICATOR_COLOR_INDEX);
//--- Set the start of drawing Values buffer
   PlotIndexSetInteger(0,PLOT_DRAW_BEGIN,RSIPeriod);
//--- Set the indicator name
   IndicatorSetString(INDICATOR_SHORTNAME,"Color RSI("+string(RSIPeriod)+")");
//--- Set an empty value for plots
   PlotIndexSetDouble(0,PLOT_EMPTY_VALUE,EMPTY_VALUE);
//--- Set buffer colors
   PlotIndexSetInteger(0,PLOT_LINE_COLOR,0,Down);
   PlotIndexSetInteger(0,PLOT_LINE_COLOR,1,Up);
//--- Receive indicator handles
   RSIHandle=iRSI(NULL,0,RSIPeriod,AppliedPrice);
//--- Set the sequence of buffer indexation
   ArraySetAsSeries(Values,true);
   ArraySetAsSeries(ValuesPainting,true);
//--- successful execution
   return(0);
  }
OnInit is the indicator initialization function. Here we configure the indicator buffers and their properties, and define the indicator variables which cannot be defined in the properties or must be set dynamically. Also there is an initial data initialization, including the handles assign that are needed for the indicators.
int OnCalculate(const int rates_total,
                const int prev_calculated,
                const datetime &time[],
                const double &open[],
                const double &high[],
                const double &low[],
                const double &close[],
                const long &tick_volume[],
                const long &volume[],
                const int &spread[])
  {
//--- number of bars for calculation
   int toCount=(int)MathMin(rates_total,rates_total-prev_calculated+1);
//--- try to copy iRSI indicator data
   if(CopyBuffer(RSIHandle,0,0,toCount,Values)==-1)
     {
      Print("Data copy error, №",GetLastError());
      //--- return command for recalculation of the indicator values
      return(0);
     }
//--- coloring. Yer, now it has become that easy
   for(int i=toCount-2;i>=0;--i)
     {
      //--- coloring the first line
      if(Values[i+1]!=EMPTY_VALUE && Values[i]>Values[i+1])
         ValuesPainting[i]=1;
      else
         ValuesPainting[i]=0;
     }
//--- return value of prev_calculated for next call
   return(rates_total);
  }
OnCalculate is the function for data calculation. This function can be of two kinds. Here is its standard form. The details are below.
Function:
//--- this function usage in not obligatory
/*
void OnDeinit()
{

}
*/
OnDeinit is the indicator deinitialization function. Often it is necessary to release the resources, for example, file handles. For other cases this function is not necessary.
Two Concepts of Indicators
The first is standard, the same as we have got used to in MQL4, but in a slightly modified form. The function OnCalculate is used instead of the function Start.
For the standard form it looks as follows:
int OnCalculate(const int rates_total,      // Arrays size
                const int prev_calculated,  // Bars processed on the previous call
                const datetime& time[],     // Data for the current chart and timeframe...
                const double& open[],
                const double& high[],
                const double& low[],
                const double& close[],
                const long& tick_volume[],
                const long& volume[],
                const int& spread[])
{
   return rates_total;
}
In order to reduce the amount of code intended for data copying, the chart data are passed directly as arrays to the parameters of the function. Moreover, the number of available bars is passed as the first parameter of the function, the number of bars processed after last call or 0 (zero) is passed as the second parameter.
The 0 (zero) value can be passed at the first indicator call, as well as when loading new or missing data. This parameter is a replacement (alternative or equivalent - it's up to you) for IndicatorCounted(), which is inconvenient for many developers.
The second concept is the replacement and expansion of the i<…>OnArray - like functions of MQL4. There is an indicator of such a type in the terminal examples - Custom Moving Average. This type of indicators is intended for data processing dependent on the user's choice, including the custom indicators.
The function for data processing for the indicators of such type looks like this:
int OnCalculate (const int rates_total,      // the size of the price[] array
                 const int prev_calculated,  // bars calculated in the previous call
                 const int begin,            // where notional data start from
                 const double& price[]       // data array for calculation
                 )
  {
   return rates_total;
  }
The last parameter of the function is the data selected by user for processing. If you want to apply an indicator with a lot of buffers, the first indicator buffer will be passed for data processing.
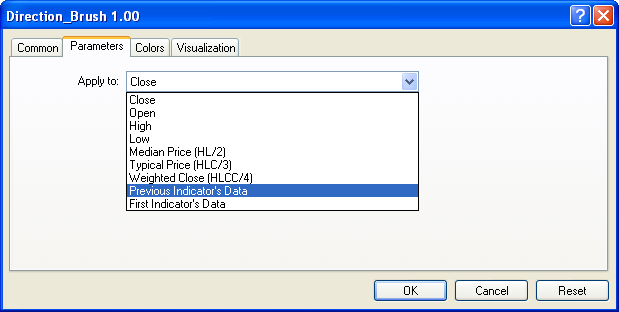
The First Indicator's Data means that the indicator will be applied to the indicator first attached to the selected window of the chart.
The Previous Indicator's Data means, that indicator will be applied to the indicator last attached to the selected window of the chart.
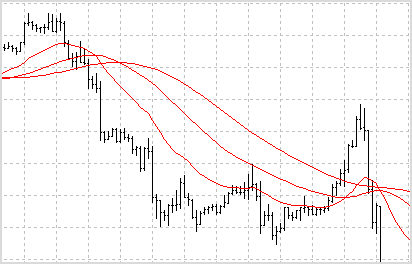
These indicators can be used to assemble the entire stacks. For example, using the Custom Moving Average indicator it is possible to get the triple smoothing by imposing the first indicator to the necessary data, the second to the first and the third to the second:
There are many standard indicators which implement this particular concept. Therefore, when you see the prompt for the function parameter applied_price_or_handle:

it indicates that the indicator is implemented the way that it can be calculated on the user data - the handle of these data must be passed as parameter applied_price_or_handle.
Using the same way it is possible to organize data processing directly in the indicator code:
  {
   //...
   RSIHandle = iRSI(NULL, 0, RSIPeriod, AppliedPrice);
   SmoothHandle = iMA(NULL, 0, SmoothPeriod, 0, MODE_EMA, RSIHandle);
   //...
  }
There is another new application of this concept - the ability to write universal service indicators. An example of such indicator is attached in the file Direction_Brush.mq5.

Results are presented on the upper chart. The direction coloring in this case is separated as an independent entity and implemented in the other indicator.
Certainly, their universality is limited, since they are applicable only for the zero buffer of the indicator. Nevertheless, I think that indicators of this type might be useful.
From the other side, when you write a custom indicator, you should take it into account, because the main information processing in the zero buffer will allow to avoid implementing a multifunctional machine in one indicator. Many of the other actions can be made and executed in the external service indicators. All that you will have to do is attach service indicators with the required functionality to your customation.
The application range is not so narrow as it might seem at first sight:
- coloring the indicator characteristics (tops, directions, levels, segments, etc.), including the tone visualization;
- different signals in different conditions;
- collecting and displaying statistics - for example, the data distribution;
- construction of universal indicators that can be calculated for one buffer - for example, moving averages, zigzag.
The features mentioned above are not the exhaustive list of the concept implementation. I think that many other effective implementations will be found later.
Accessing Data
The data access principles have changed in MQL5. Now the work occurs directly in the arrays, and as a result, the calculation speed has increased significantly. Now it's not necessary to create an array and call the iCustom function for each value. Instead, it is possible to get the necessary data count by calling one function, and then directly use the demanded data copied in a local array specified.
Data copying is implemented by using the system function CopyBuffer. You can find the function description in the help.
The maximum data count to copy for the indicator and static (with a predefined size) arrays is determined by the size of the array. The size of dynamic array can be changed if the number of copied data exceeds its size.
Besides, there are special functions for accessing historical data:
| Function | Description |
|---|---|
| CopyBuffer | Gets data of a specified buffer of a certain indicator in the necessary quantity. |
| CopyRates | Gets history data of MqlRates structure of a specified symbol-period in specified quantity into the rates_array array. |
| CopyTime | The function gets to time_array history data of bar opening time for the specified symbol-period pair in the specified quantity. |
| CopyOpen | The function gets into open_array the history data of bar open prices for the selected symbol-period pair in the specified quantity. |
| CopyHigh | The function gets into high_array the history data of highest bar prices for the selected symbol-period pair in the specified quantity. |
| CopyLow | The function gets into low_array the history data of minimal bar prices for the selected symbol-period pair in the specified quantity. |
| CopyClose | The function gets into close_array the history data of bar close prices for the selected symbol-period pair in the specified quantity. |
| CopyTickVolume | The function gets into volume_array the history data of tick volumes for the selected symbol-period pair in the specified quantity. |
| CopyRealVolume | The function gets into volume_array the history data of trade volumes for the selected symbol-period pair in the specified quantity. |
| CopySpread | The function gets into spread_array the history data of spread values for the selected symbol-period pair in the specified quantity. |
Details can be found in help.
This data is passed in only one form of the indicator, for the other they should get their own.
Due to the fact that the type of the historical data array is not necessarily double, it is recommended to use only dynamic non-indicator buffers for their storage.
Also there is one more undocumented detail - if the copied data count is equal to 0 (zero), the function CopyBuffer will generate an error with code №4003, therefore the data count to copy should be not less than 1 (one) element.
The Indicator Buffers
The buffers count is not limited.
Now you don't have to think how to accommodate the information correctly, how to perform the intermediate calculations efficiently, working on creation of the cluster indicator.
But we should not forget that the buffers storage requires memory. Therefore, if you specify a terminal history depth about 1,000,000 bars and attach the "thick" cluster indicator to the minute chart, do not be surprised when the terminal eats Gb of memory.
The essence of the buffer also has undergone some changes. The amount of the buffers used is specified in the in property.
#property indicator_buffers 2 // buffers used
This value should correspond to the total buffers count.
The number of displayed buffers is defined by the property:
#property indicator_plots 1 // buffers displeyed
Here is some detail. The most of the drawing styles needs only one INDICATOR_DATA buffer for drawing. However, there are some styles that require several indicator buffers for drawing.
We mean the following drawing styles:
- DRAW_HISTOGRAM2 - requires two indicator buffers (HistogramSample.mq5)

- DRAW_FILLING - requires two indicator buffers (CrossMa.mq5)

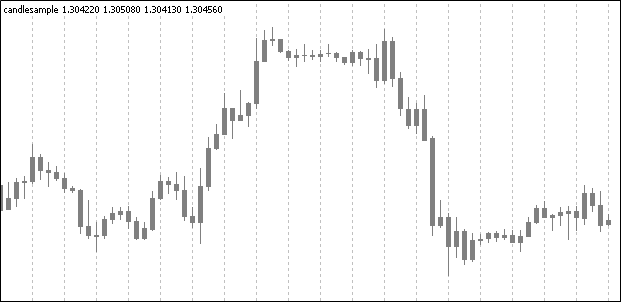
- DRAW_CANDLES - requires four indicator buffers (CandleSample.mq5)
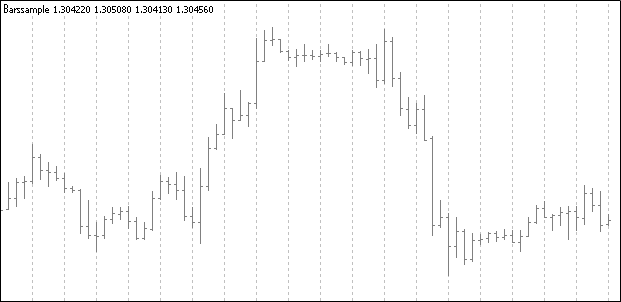
- DRAW_BARS - requires four indicator buffers (BarsSample.mq5)
All of the above types except DRAW_FILLING style (it can't be colored), have colored analogues.
All indicator buffers are now divided into 3 types:
-
INDICATOR_DATA - buffers, whose data are displayed on the chart. These buffers are intended for drawing and for working with iCustom. They should be registered first. In the case of their arbitrary order (wrong), the code will be compiled successfully and it will be drawn when applied to a chart, however, most likely, incorrectly.
-
INDICATOR_COLOR_INDEX - buffers for a colors storage. They are necessary for storing the color buffer indexes of INDICATOR_DATA type, having one of special color types (#property indicator_typeN). Such buffer (we name its color buffer) should be registered right after the main buffer, which uses it.
-
INDICATOR_CALCULATIONS - buffers of such a type are intended for storing results of auxiliary calculations. They are not displayed on the chart.
int OnInit()
{
   // ...
   SetIndexBuffer(0, V2, INDICATOR_DATA);
   SetIndexBuffer(1, V2C,INDICATOR_COLOR_INDEX);
   SetIndexBuffer(2, V4, INDICATOR_DATA);
   SetIndexBuffer(3, V4C,INDICATOR_COLOR_INDEX);
   SetIndexBuffer(4, V1, INDICATOR_CALCULATIONS);
   SetIndexBuffer(5, V3, INDICATOR_CALCULATIONS);

   // ...
   return 0;
}
There are also some features when referring to indicators via iCustom.
- Buffers for drawing (the ones that are displayed on the chart) are
available for reading. The buffer number (index) must match the one, for which
the buffer is registered.
- Buffers for a color storage may be available for reading, but not always. For example, in the code above buffer V2C can read and obtain the necessary values, but the buffer V4C is unavailable.
- Buffers for intermediate calculations are not available, as it was in MQL4. If you want to have guaranteed access to the external data buffer, declare it as INDICATOR_DATA.
In case of the request to the inaccessible buffer, the error 4806 ("The requested data was not found") will be generated.
Let's consider the color buffers in details.
In MQL4, for each color it was necessary to create a separate buffer, but now using the color styles, you can specify up to 63 colors for a one buffer. In some cases, it will allow to optimize the number of the buffers used, and thus to save the memory usage. It also opens new possibilities for writing indicators, in particular, the use of tone visualization.
In addition, this innovation in some cases, greatly simplifies the logic of the application of several colors in comparison with MQL4. The most obvious example - separation of trends by colors. In MQL4 for the very economical (from correct cases) case of implementation it has required three (3) buffers and non-trivial programming.
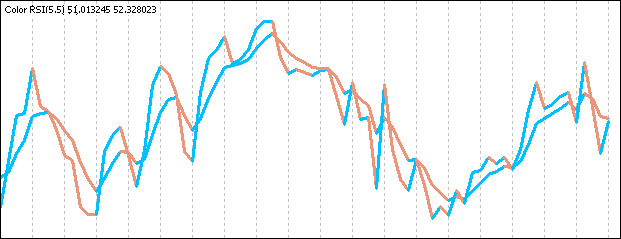
Now it easier than ever. Here are the code samples, the complete implementation can be found in file Color_RSI.mq5.
#property indicator_color1 clrDarkSalmon, clrDeepSkyBlue // use 2 colors
#property indicator_type1  DRAW_COLOR_LINE               // and the special color display type
//---- buffers
double Values[];                 // buffer of values
double ValuesPainting[];         // buffer of color indices
//+------------------------------------------------------------------+
//| Custom indicator initialization function                         |
//+------------------------------------------------------------------+
int OnInit()
  {
//--- bind indicator buffers
//--- Values serves as a display buffer
   SetIndexBuffer(0,Values,INDICATOR_DATA);
//--- ValuesPainting serves as the buffer for storing colors
   SetIndexBuffer(1,ValuesPainting,INDICATOR_COLOR_INDEX);
//...
   return(0);
  }
//+------------------------------------------------------------------+
//| Custom indicator iteration function                              |
//+------------------------------------------------------------------+
int OnCalculate(/*...*/)
  {
//--- number of bars for calculation
   int toCount=(int)MathMin(rates_total,rates_total-prev_calculated+1);
//--- try to copy iRSI indicator data
   if(CopyBuffer(RSIHandle,0,0,toCount,Values)==-1)
     {
      Print("Data copy error, №",GetLastError());
      //--- return command for recalculation of the indicator values
      return(0);
     }
//--- coloring. Yer, now it has become that easy
   for(int i=toCount-2;i>=0;--i)
     {
      //--- coloring the first line
      if(Values[i+1]!=EMPTY_VALUE && Values[i]>Values[i+1])
         ValuesPainting[i]=1;
      else
         ValuesPainting[i]=0;
     }
//--- return value of prev_calculated for next call
   return(rates_total);
  }
Some more code, and we get the following:
You should note some of details when using color types for drawing.
For the color buffers, when using a dynamic color definition scheme, the maximal colors count is limited by the colors count defined in the indicator_colorN property. For example
#property indicator_color1 clrDarkSalmon, clrDeepSkyBlue // use 2 colors
color scheme of the buffer will contain maximum two colors, even if you will set a larger number of colors dynamically (using the PlotIndexSetInteger).
Therefore, the required number of colors should be written in one line - property definition line. Then they can be changed dynamically. The shortest color which I have found - "Red". However, you can always do the following:
Instead of
#property indicator_color1 clrRed, clrRed, clrRed, clrRed, clrRed, clrRed, clrRed, clrRed, //…
you may write:
#define C clrRed
#property indicator_color1  C, C, C, C, C, C, C, C, C, C, C, C, C, C, //…
The maximum number of colors for a buffer is 63. When the color number greater than the maximal (defined by property indicator_colorN) buffer will not be displayed.
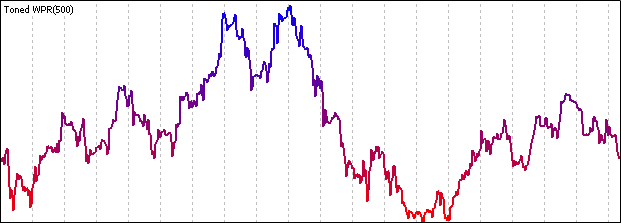
Here is an example of tone visualization, using the maximum number of colors:
In general, the drawing opportunities have significantly increased, and that's great.
Arrays
During the direct reference to the array data by indexes, it is necessary to mean the data ordering type - AsSeries property. It cannot be defined for some of the array types.
This flag cannot be set for the multidimensional and for static arrays. For the array types, which are passed to the OnCalculate function it is possible to set such a flag.
The data copying using the function CopyBuffer doesn't depend on the AsSeries property, but its implementation is different for different buffers.
For indicator buffers it is necessary to copy the entire depth of available history. It must be remembered.
For dynamic and static (with a predefined size) arrays the data copying is performed from the present to the past.
The function CopyBuffer changes the size of buffers for dynamic (except indicator's) buffers for the necessary size.
It is not recommended to use the static arrays for data copying.
In general, I advise you always to check, how you copy data and how you address them. The most simple and safe way is:
- to set the AsSeries property for all of the buffers used for a storage of history data.
- to take into account the buffer structures for the different buffers.
- to always check the value of _LastError variable (last error code).
In addition, I strongly advise to study the help for the CopyBuffer function and for all of the functions connected with AsSeries property.
IndicatorCounted
Now the debates about the necessity of the IndicatorCounted function will sink into oblivion, because this value is defined directly by us as return value of the previous function call.
int OnCalculate(const int rates_total,      // array size
                const int prev_calculated,  // bars processed after last call
                //...)
  {
   return rates_total;
  }
More often it is enough to return the rates_total value which contains the bars count of the current function call.
However, if the price data were changed since the last OnCalculate() call (for example, history data were loaded or the history data blanks were filled), then the value of the input parameter prev_calculated
will be set to 0 (zero) by the client terminal.
Also, if OnCalculate function returns zero, then the indicator values are not shown in the DataWindow of the client terminal. Therefore, if you want to see the indicator and perform it sfull recalculation during the history loading process or after a connection failure, return 1 instead of 0.
The another useful feature which has been added is determining how many bars has been calculated for the indicator. It is more useful for Expert Advisors which perform calculations on a large data. The function is BarsCalculated, its details can be found in the help.
This function has another useful application. If the indicator hasn't been loaded, its loading may take some time - the time between the indicator handle creation and its use for the calculations.
This time is required for initialization and its initial precalculation. It depends on the calculation speed and indicator details.
During this time, the call for the CopyBuffer function generates the error 4806 - "The requested data was not found".
The function BarsCalculated can be used to determine the availability of the indicator data for copying:
//--- number of bars for calculation
   int toCount=rates_total-(int)MathMax(prev_calculated-1,0);
//--- try to copy iWPR indicator data
   int copied=CopyBuffer(WPRHandle,0,0,toCount,Values);
   int err=GetLastError();
//--- check coying result
   if(copied==-1)
     {
      //--- if error number is 4806, the data simply have not been uploaded yet
      if(err==4806)
        {
         //--- wait till the data is uploaded
         for(int i=0;i<1000;++i)
            if(BarsCalculated(WPRHandle)>0)
               break;
         //--- try to copy iWPR indicator data again
         copied=CopyBuffer(WPRHandle,0,0,rates_total,Values);
         err=GetLastError();
        }
     }
//--- check coying result
   if(copied==-1)
     {
      Print("Error when trying to get WPR values, last error is ",err," bars ",rates_total);
      return(0);
     }
//...
Summary
In conclusion, I would like to say that just some of the details have been considered in this article. But I hope that the basic aspects are presented here.
It would be great if this article were a useful reference on the subject, where you could always look and find information about the details.
If you have found any mistakes in this article, or have discovered something important, please inform me and I will try to correct it and improve the article as soon as possible.
I am planning to outine the recent changes, besides that, I hope that some of the useful information will appear in comments.
That's the reason to read them carefully.
Appendix
- Color.mqh - include file, copy this file to the folder MQL5/Include. This file is necessary for the Toned_WPR indicator.
- Color.mq5 - library, copy this file to the folder MQL5/Libraries. This file is necessary for the Toned_WPR indicator.
All of the over files are indicators.
Acknowledgments
Again, I would like to thank Mr. Victor Rustamov (granit77) for the manuscript reading, useful discussions and helpful advices.
 FANN2MQL Neural Network Tutorial
 Auto-Generated Documentation for MQL5 Code
 Meta COT Project - New Horizons for CFTC Report Analysis in MetaTrader 4
 Trader's Kit: Decorating Indicators
- Free trading apps
- Over 8,000 signals for copying
- Economic news for exploring financial markets
You agree to website policy and terms of use
I was able to fix this problem only defining just one buffer flagged as INDICATOR_DATA and move all the others to INDICATOR_CALCULATIONS, this way CopyBuffer/GetData return the right copied items into the target arrays.