
Trader's Kit: Decorating Indicators

Introduction
What is an indicator? It is a tool intended for displaying a certain type of data. Usually it is information about the price series properties, exactly this type of indicators will be considered further.
Each indicator also has its own properties and characteristics: for example, the range of values, the overbuying/overselling zones, the line crossing, tops and bottoms... They are numerous and can be successively used together with the main indicator values. However, such properties are not always vivid. The reasons can be different - small size of the indicator window, lower concentration, etc.
The purpose of this article is to help you to improve the descriptive and informational value of indicators, as well as partial automation and facilitation of the code implementation process. I hope the code below will cause no difficulties both for professional developers and beginners.
The article is intended for those who have at least the starting level of MQL4 knowledge and can implement simple ideas and algorithms in a code, as well as knows about the structure of code storage in the terminal and can use the libraries (experts/libraries) and header files (experts/include).
1. Setting Up a Task
Among all indicators I would like to outline the most informative and often used ones:
- Line crossing.
Level - not just level crossing points, but the whole level will be highlighted.
Tops/bottoms in a simple interpretation.
Different coloring for upward/downward direction.
Let's discuss them.
2. Basic Notions
In order to avoid misunderstanding, let's spend some time viewing the indicator structure.
#property indicator_separate_window

// number of visible buffers of the indicator
#property indicator_buffers 3

// setting the range of indicator values
#property indicator_minimum 0
#property indicator_maximum 100

// setting indicator colors
#property indicator_color1  White
#property indicator_color2  Red
#property indicator_color3  Blue

// external settings
extern int RSIPeriod       = 9;
extern int AppliedPrice    = 0;
extern int MAPeriod        = 5;

// declaring indicator buffers. Here they can be declared in any order.
// Any names can be given to buffers, though better meaningful

double Values[];           // Values
double SmoothedValues[];   // Smoothed values
double Crosses[];          // intersections

// Significant number of digits after a decimal point in indicator values
int DigitsUsed = 5;

// Used empty value. In MQL4 there are two empty values -- EMPTY (-1)
// -- used as an empty parameter when calling functions
// EMPTY_VALUE (0x7FFFFFFF) -- used as an unacceptable value
// (or default value) of a variable in indicators and function calls.
// The fact is, most built-in indicators return 0 if there is no value
// Besides, in custom (iCustom) indicators the empty value can be
// set as any, this must be noted.
int EmptyValueUsed = 0;

// Initialization function.
int init()
{
   // Number of used buffers can be larger than that of displayed ones; some
   // may contain intermediate calculations and additional information. The total
   // number of buffers including additional ones is displayed here.
   // If there are no additional buffers,
   // this line is not needed. Total number must not exceed 8
   // IndicatorBuffers(3);

   // associate buffers. Indexes must go from 0 till the declared number (not including)
   // buffers are drawn in the order of index growing, this is important and can be
   // used when righting indicators further.
   // It means that a buffer with a larger index is drawn above the buffer with lower one
   SetIndexBuffer(0, Values);
   SetIndexBuffer(1, SmoothedValues);
   SetIndexBuffer(2, Crosses);
   // besides, it is important that additional buffers are located after displayed ones
   // (i.e. they must have higher index) otherwise problems may occur displaying buffers,
   // and sometimes the error can be hardly found

   // This function sets an empty value for the buffer with the preset index
   // I do not recommend to use this function in order to avoid possible difficulties
   // Default empty value for buffers -- EMPTY_VALUE.
   // Empty buffer values are not drawn in a chart (except for DRAW_ZIGZAG)

   // SetIndexEmptyValue(0, EMPTY_VALUE);

   // Set parameters for buffers
   SetIndexStyle(0, DRAW_LINE);     // The main signal is a solid line
   SetIndexStyle(1, DRAW_LINE, STYLE_DASH); // Smoothed -- dotted line
   SetIndexStyle(2, DRAW_ARROW, STYLE_SOLID, 2); // Intersections -- crosses of the size 2

   SetIndexArrow(2, 251); // cross code in Wingdings

   IndicatorDigits(DigitsUsed); // set number of significant digits after point

   // Setting the starting plotting point for each indicator. If in terms of the current index
   // the history depth
   // is lower than the value written here, the buffer value with this index will not be drawn.
   SetIndexDrawBegin(0, RSIPeriod);
   SetIndexDrawBegin(1, RSIPeriod + MAPeriod);
   SetIndexDrawBegin(2, RSIPeriod + MAPeriod + 1);

   return(0);
}

int start()
{
   // counting number of bars for re-calculation
   int toCount = Bars - IndicatorCounted();

   // Calculating values
   // counting from history start till the current moment
   for (int i = toCount - 1; i >=0; i--)
   {
      // I understood its convenience only when I started to use it
      // I recommend to conduct the normalization of data at once,
      // so that later comparison could be easily made
      Values[i] = NormalizeDouble(iRSI(Symbol(), 0, RSIPeriod, AppliedPrice, i), DigitsUsed);
   }

   // Counting smoothed values
   for (i = toCount - 1; i >=0; i--)
   {
      SmoothedValues[i] = NormalizeDouble(iMAOnArray(Values, 0, MAPeriod, 0, MODE_EMA, i), DigitsUsed);
   }

   // ...

   return(0);
}
3. Characteristics
Let's consider the characteristics in details.
3.1. Line Crossing
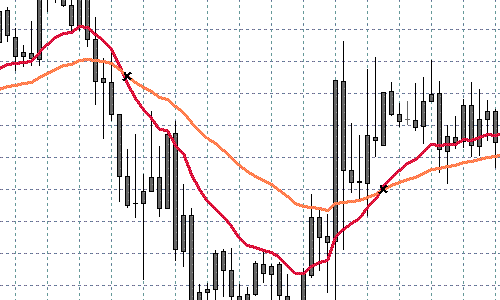
Perhaps every developer has tried to implement a trading algorithm using the crossing of two MAs (moving averages); or the same of MACD's base line and signal line crossing. Let's try to visualize it and make it much more evident by displaying the cross point in the indicator.
As an example, throughout the text we will use the Relative Strength Index, so our aim is to develop an improved RSI with some new advantages.
3.1.1. Task Formalization
It is necessary to mark the line crossing bars in a separate buffer.
3.1.2. Problems
It seems that everything is simple and clear. The task is not difficult and it can be solved by a couple of code lines.
We have to describe the line crossing like this one:
if ((x1 > y1 && x2 < y2) || (x1 < y1 && x2 > y2))
{
    // line crossing here
}
Or we can simplify it:
if ((x1 > y1 && x2 < y2) || (x1 < y1 && x2 > y2))
{
    // line crossing here
}
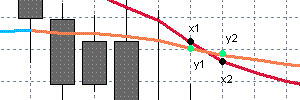
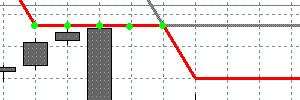
But let's consider the following case:
Note that the green points have the same values. In such a case we have no line crossing, just a line touching case only.
But here:
it is not so simple to determine the crossing, this case is quite possible.
And also it is necessary to distinguish correctly a touching case from the crossing case, taking into account that during search we can find an empty value in a buffer or history end.
3.1.3. Solution
From this place on the function init() will not be considered, because it is not important. The full code can be found in the source.
Here is the solution for the simple and smoothed values of the Relative Strength Index Indicator.
//|                                 RSI_Crosses_Sample.mq4 |

extern int RSIPeriod       = 9;
extern int AppliedPrice    = 0;
extern int MAPeriod        = 5;

// buffers
double Values[];           // Values
double SmoothedValues[];   // Smoothed values
double Crosses[];          // Crosses

int DigitsUsed = 5;
int EmptyValueUsed = 0;

int start()
{
   int toCount = Bars - IndicatorCounted();

   // Reading the values and normalizing them
   // Mark the crosses
   for (i = toCount - 1; i >=0; i--)
   {
      // i+1 must be greater or equal bars count in the history
      if (i + 1 >= Bars)
      {
         continue;
      }

      // if some of the values are empty, it is not necessary to check
      if (
            Values[i]               == EmptyValueUsed ||
            Values[i + 1]           == EmptyValueUsed ||
            SmoothedValues[i]       == EmptyValueUsed ||
            SmoothedValues[i + 1]   == EmptyValueUsed ||
            Values[i]               == EMPTY_VALUE    ||
            Values[i + 1]           == EMPTY_VALUE    ||
            SmoothedValues[i]       == EMPTY_VALUE    ||
            SmoothedValues[i + 1]   == EMPTY_VALUE
      )
      {
         continue;
      }

      // clear the current value
      Crosses[i] = EMPTY_VALUE;

      // crossing check (simple case)
      if ((Values[i] - SmoothedValues[i])*(Values[i + 1] - SmoothedValues[i + 1]) < 0)
      {
         Crosses[i] = SmoothedValues[i];
         continue;
      }

      // the crossing condition for a complicated case -
      // when crossing contain several bars with the same values
      //
      if (Values[i + 1] == SmoothedValues[i + 1] && Values[i] != SmoothedValues[i])
      {
         // there is potential crossing - checking it
         // lets find the second end

         int index = i + 1;
         bool found = false;
         while (
               index < Bars &&    // out of range
               Values[index] != EmptyValueUsed &&   // check for empty
               Values[index] != EMPTY_VALUE &&      // check for empty
               SmoothedValues[index] != EmptyValueUsed &&  // check for empty
               SmoothedValues[index] != EMPTY_VALUE)       // check for empty
         {
            if (Values[index] != SmoothedValues[index])
            {
               // ok, we have found the second end
               found = true;
               break;
            }

            index++;
         }

         if (!found)
         {
            // the case of the end of history or empty value
            // anyway, we mean that there is no crossing
            continue;
         }

         // checking the ends for crossing
         if ((Values[i] - SmoothedValues[i])*(Values[index] - SmoothedValues[index]) < 0)
         {
            // crossing found
            Crosses[i] = SmoothedValues[i];
         }  // else we have a touching - do not mark it

      }
   }

   return(0);
}
3.1.4. Automation
In this section we consider the solution of the problem using the Indicator_Painting library.
//|                                 RSI_Crosses_Lib_Sample.mq4 |

#include <Indicator_Painting.mqh>

extern int RSIPeriod       = 9;
extern int AppliedPrice    = 0;
extern int MAPeriod        = 5;

// buffers
double Values[];           // Values
double SmoothedValues[];   // Smoothed values
double Crosses[];          // Crosses

int DigitsUsed = 5;
int EmptyValueUsed = 0;

int start()
{
   // Reading values
   // ...

   // Mark crosses
   MarkCrosses
   (
      Values,            // the fast buffer with values to check
      SmoothedValues,    // the slow buffer with values to check
      Crosses,           // the crosses buffer
      toCount - 1,       // start check index
      0,                 // final check index
      CROSS_ALL,         // use CROSS_UP for up crosses CROSS_DOWN for down crosses CROSS_ALL for all
      0);                // used empty value

   return(0);
}
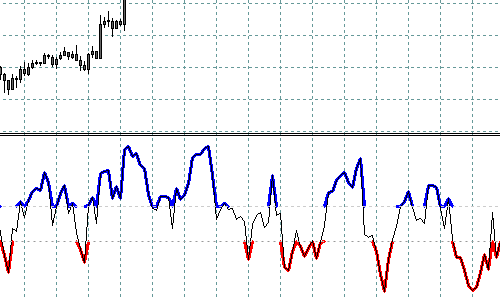
3.2. Level Mark
Some of the oscillators with limited and strictly set range of values (RSI, Stochastic Oscillator, DeMarker, Money Flow Index, Williams' Percent Range) often need to mark zones or levels. For example, the flat zones, the overbought\oversold zones, the trend zones... Let's try to outline the defined level by using the different color painting.
3.2.1. Task Formalization
It is necessary to mark in a separate buffer the bars with the values outside of the defined levels.
3.2.2. Problems
It is not as simple as it seems at first sight.
The first problem is drawing bars, on which the defined level is crossed. Here is the solution.
//|                                 RSI_Cut_Levels_Sample.mq4 |

extern int RSIPeriod       = 9;
extern int AppliedPrice    = 0;

extern int HigherLevel     = 70;
extern int LowerLevel      = 30;

// buffers
double Higher[];           // Overbought
double Lower[];            // Oversold
double Values[];           // Values

int DigitsUsed = 5;
int EmptyValueUsed = 0;

int start()
{
   int toCount = Bars - IndicatorCounted();

   // Reading values
   // ...

   // Mark levels - upper
   for (i = toCount - 1; i >=0; i--)
   {
      // check for empty values
      if (Values[i] == EMPTY_VALUE || Values[i] == EmptyValueUsed)
      {
         continue;
      }

      // empty current value
      Higher[i] = EMPTY_VALUE;

      // greater than high
      if (Values[i] >= HigherLevel)
      {
         Higher[i] = Values[i];
      }
   }

   // for the levels mark - the code is same
   // ...

   return(0);
}
This code solves the task defined, but it has one problem:
It is difficult to analyze it visually, because the signal drawing starts from the value, which is greater (lower) than the level. That's why some of the signal bars cannot be analyzed because of the drawing peculiarities caused by rapid changes of the neighbour bars.
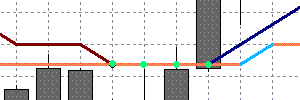
The solution is to mark not only the bars higher (lower) than the defined level, but also the bar formed prior to the already marked ones and the one next to them. And it is necessary to mark them not with their own values, but with the values of the level.
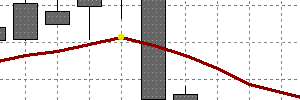
The second problem appears after the solution of the first - the signal buffer has pseudo-marks of the "false" level breakdowns as a result of algorithm complication.
It means that the price was outside the level during the bar formation, however the final bar has the value inside the level. Because of this fact we can get a picture like this:
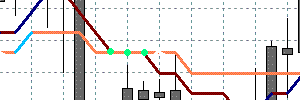
The problem appears only if we use an indicator on the realtime quotes. The solution is simple - we are checking two bars (0 and 1) while processing, the others are checked only if necessary.
Afterthat, we will have the following picture for RSI:
3.2.3. Solution
So, let's write all it in a code:
//|                                 RSI_Levels_Sample.mq4 |

extern int RSIPeriod       = 9;
extern int AppliedPrice    = 0;

extern int HigherLevel     = 70;
extern int LowerLevel      = 30;

// buffers
double Higher[];           // Overbought
double Lower[];            // Oversold
double Values[];           // Values

int DigitsUsed = 5;
int EmptyValueUsed = 0;

// looking at least two bars - 0 and 1.
int Depth = 2;

int start()
{
   int toCount = Bars - IndicatorCounted();

   // Reading values
   // ...

   toCount = MathMax(toCount, Depth);

   // Marking levels - upper
   for (i = toCount - 1; i >=0; i--)
   {
      if (Values[i] == EMPTY_VALUE || Values[i] == EmptyValueUsed) continue;

      Higher[i] = EMPTY_VALUE;

      // greater than level
      if (Values[i] >= HigherLevel)
      {
         Higher[i] = Values[i];

         // if previous is lower
         if (Values[i + 1] < HigherLevel && Values[i + 1] != EmptyValueUsed)
         {
         // mark it also but with the level value
            Higher[i + 1] = HigherLevel;
         }
      }
      // if current lower
      else
      {
         // if previous is greater
         if (Values[i + 1] >= HigherLevel && Values[i + 1] != EMPTY_VALUE)
         {
            // mark it also but with the level value
            Higher[i] = HigherLevel;
         }
      }
   }

   // Mark levels - the code is the same
   // ...

   return(0);
}
3.2.4. Automation
The solution of the same problem by using the Indicator_Painting library.
//|                                 RSI_Levels_Lib_Sample.mq4 |

#include <Indicator_Painting.mqh>

extern int RSIPeriod       = 9;
extern int AppliedPrice    = 0;

extern int HigherLevel     = 70;
extern int LowerLevel      = 30;

// buffers
double Higher[];           // Overbought
double Lower[];            // Oversold
double Values[];           // Values

int DigitsUsed = 5;
int EmptyValueUsed = 0;
int Depth = 2;

int start()
{
   int toCount = Bars - IndicatorCounted();

   // Read values
   for (int i = toCount - 1; i >= 0; i--)
   {
      Values[i] = NormalizeDouble(iRSI(Symbol(), 0, RSIPeriod, AppliedPrice, i), DigitsUsed);
   }

   // Mark levels - upper
   MarkLevel(Values, Higher, 0, toCount - 1, HigherLevel, GREATER_THAN, EmptyValueUsed);
   // Mark levels - lower
   MarkLevel(Values, Lower, 0, toCount - 1, LowerLevel, LESS_THAN, EmptyValueUsed);

   return(0);
}
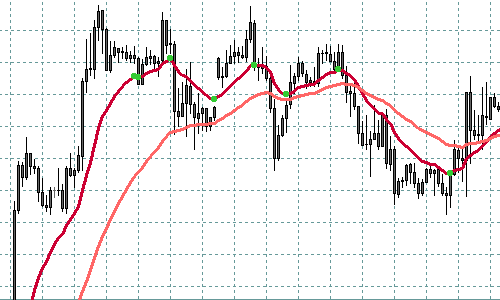
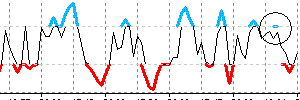
3.3. Tops and Bottoms
The extreme points (extremums) of the indicator can be used as signals. In this article the "extremum" term is used in its simplest meaning - if the bar has a greater (lower) value than its neighbour values, it is considered extremum.
3.3.1. Task Formalization
It is necessary to mark the bars with extreme values in a separate buffer.
3.3.2. Problems
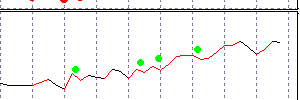
Let's consider some examples:
Here evident extreme values are marked with red lines:
if ((x1 > x2 && x3 > x2) || (x1 < x2 && x3 < x2))
{
    // x2 is extremal
}
Or we can simplify it:
if ((x1 - x2)*(x2 - x3) < 0)
{
    // x2 is extremal
}
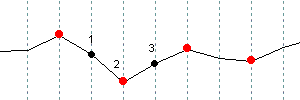
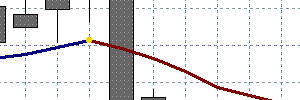
But let's consider the case:
The marked points have the same values. The blue point is an extremum. It will be not easy to define it. And in the following case:
there is no extremum, we assume that there is a bend.
The solution of such cases is to find the second end, like for the crossing cases.
3.3.3. Solution
Here is the code:
//|                                 RSI_Extremums_Sample.mq4 |

extern int RSIPeriod       = 9;
extern int AppliedPrice    = 0;

// buffers
double Values[];           // Values
double Extremums[];        // Extremums

int DigitsUsed = 5;
int EmptyValueUsed = 0;

int start()
{
   int toCount = Bars - IndicatorCounted();
   for (int i = toCount - 1; i >=0; i--)
   {
      Values[i] = NormalizeDouble(iRSI(Symbol(), 0, RSIPeriod, AppliedPrice, i), DigitsUsed);
   }

   for (i = toCount - 1; i >=0; i--)
   {
      // check the values relative to the current index.
      if (i + 2 >= Bars)
      {
         continue;
      }

      // check for empty values, if there are, it is not necessary to check
      if (
            Values[i]      == EmptyValueUsed ||
            Values[i + 1]  == EmptyValueUsed ||
            Values[i + 2]  == EmptyValueUsed
      )
      {
         continue;
      }

      // fill the current value of the mark buffer
      Extremums[i + 1] = EMPTY_VALUE;

      // cross condition - the simple case
      if ((Values[i] - Values[i + 1])*(Values[i + 1] - Values[i + 2]) < 0)
      {
         // we have found the cross
         Extremums[i + 1] = Values[i + 1];
         continue;
      }

      // the cross condition in a complicated case -
      // when top contain several bars with the same value
      if (Values[i + 1] == Values[i + 2] && Values[i] != Values[i + 1])
      {
         // there is possible extremum - to check it
         // we have to find the second end

         int index = i + 2;
         bool found = false;
         while (index < Bars && Values[index] != EmptyValueUsed && Values[index] != EMPTY_VALUE)
         {
            if (Values[i + 2] != Values[index])
            {
               // ok, we have found the second end
               found = true;
               break;
            }

            index++;
         }

         if (!found)
         {
            // we are at the end of the history or have an empty value
            // for the both cases we assume that there is no extremum
            continue;
         }

         // checking the ends for a cross
         if ((Values[i] - Values[i + 1])*(Values[i + 1] - Values[index]) < 0)
         {
            // there is a cross
            Extremums[i + 1] = Values[i + 1];
         }  // else -- there is a bend point, do not mark it
      }
   }

   return(0);
}
3.3.4. Automation
The same task solution by using the Indicator_Painting library.
//|                                 RSI_Extremums_Lib_Sample.mq4 |

#include <Indicator_Painting.mqh>

extern int RSIPeriod       = 9;
extern int AppliedPrice    = 0;

// buffers
double Values[];           // Values
double Extremums[];        // Extremal points

int DigitsUsed = 5;
int EmptyValueUsed = 0;

int start()
{
   int toCount = Bars - IndicatorCounted();

   for (int i = toCount - 1; i >=0; i--)
   {
      Values[i] = NormalizeDouble(iRSI(Symbol(), 0, RSIPeriod, AppliedPrice, i), DigitsUsed);
   }

   MarkExtremums(Values, Extremums, toCount - 1, 0, DIR_ALL, EmptyValueUsed);

   return(0);
}
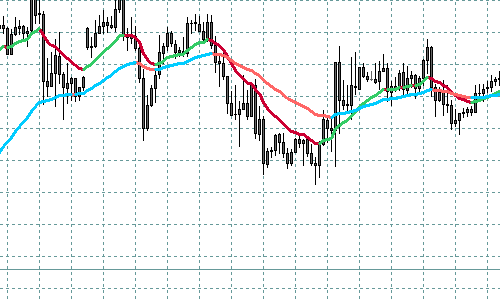
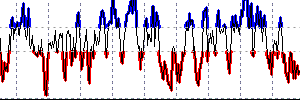
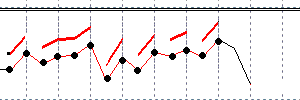
3.4. Coloring by Direction
This visualization method is used in some standard indicators and and also can be useful.
3.4.1. Task Formalization
It is necessary to paint some sets of the indicator values (for example the sets while it goes upward or downward) with different colors. The direction is meant in the simplest case - if the current value is greater than previous, we have upward direction, otherwise we assume a downward direction.
3.4.2. Problems
Let's start from the feature. It's assumed that we have a base data buffer and this buffer is plotted. If not so, we will do it, because for the custom directional painting we need at least 2 colors, and at least two buffers. Now the feature. If we draw one of directions over the base buffer, it is not necessary to paint the other direction - we will see it on the unpainted pieces of the base buffer.
The base buffer:
Here is the base buffer with upward direction plotted:
That's why further we will consider the only one direction plot, upward for example. Let's consider the problems that may occur.
The naive implementation of the feature is the following:
//|                                 RSI_Simple_Directions_Sample.mq4 |

extern int RSIPeriod       = 9;
extern int AppliedPrice    = 0;

// buffers
double Values[];           // Values
double Growing[];          // Growing buffer

int DigitsUsed = 5;
int EmptyValueUsed = 0;

int start()
{
   int toCount = Bars - IndicatorCounted();

   // Reading values
   for (int i = toCount - 1; i >=0; i--)
   {
      Values[i] = NormalizeDouble(iRSI(Symbol(), 0, RSIPeriod, AppliedPrice, i), DigitsUsed);
   }

   // Mark the growing levels - we will get the falling levels as a result
   for (i = toCount - 1; i >=0; i--)
   {

      // check for empty value, if there are, the further check is not necessary
      // ...

      // filling the current values with empty values
      Growing[i] = EMPTY_VALUE;

      // if growing
      if (Values[i] > Values[i + 1])
      {
         Growing[i] = Values[i];
         Growing[i + 1] = Values[i + 1];
      }
   }

   return(0);
}
Compiling, attaching to charts and... see the result of code execution:
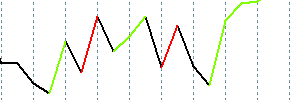
There are some troubles, they are marked with points. Let's consider, why it looks so. While painting one direction, we get an effect by leaving empty values (EMPTY_VALUE) at other parts.
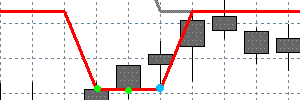
Lets' consider the following case:
The additional buffer data which should have nonempty values are marked by black points. To avoid the straight line plotting between the points (using the style DRAW_LINE) it is necessary to have at least one nonempty value between them. All of the plotted range has no empty values, that's why base buffer is plotted only at "sawtooth" pieces.
The solution of this problem is unevident - for example smoothing or use of some of the additional conditions makes it much more complicated. As a result we might get several bars repainting or something else difficult.
The solution is to use two additional buffers for it. Then it is possible to alternate the painted pieces - thus, we will get the necessary empty values in each of the buffers.
Let's assign the different colors to the additional buffers and see the result:
The main problem is solved, but there is another small problem with the zero bar. It is redrawn every time, and in some cases it is necessary to delete the upward direction plot, if the direction has changed.
Lets consider the implementation.
3.4.3. Solution
//|                                 RSI_Directions_Sample.mq4 |

extern int RSIPeriod       = 9;
extern int AppliedPrice    = 0;

// buffers
double Values[];           // Values
double Growing1[];         // First growing buffer
double Growing2[];         // Second growing buffer

int DigitsUsed = 5;
int EmptyValueUsed = 0;

int start()
{
   int toCount = Bars - IndicatorCounted();

   // Reading values
   for (int i = toCount - 1; i >=0; i--)
   {
      Values[i] = NormalizeDouble(iRSI(Symbol(), 0, RSIPeriod, AppliedPrice, i), DigitsUsed);
   }

   // Mark for the growing levels - we will get the falling levels as a resut
   for (i = toCount - 1; i >=0; i--)
   {
      // check of an empty values
      // ...

      // assume that the current values are empty
      Growing1[i] = EMPTY_VALUE;
      Growing2[i] = EMPTY_VALUE;

      // if it growing
      if (Values[i] > Values[i + 1])
      {
         // if it growing on the previous bar
         if (Values[i + 1] > Values[i + 2])
         {
            // writing to the current growing buffer
            if (Growing1[i + 1] != EMPTY_VALUE) Growing1[i] = Values[i];
            else                                Growing2[i] = Values[i];
         }
         // if the previous bar was not increasing
         else
         {
            // write to the buffer which it was not used the last 2 bars
            // we must have at least one such bar

            if (Growing2[i + 2] == EMPTY_VALUE)
            {
               Growing2[i] = Values[i];
               Growing2[i + 1] = Values[i + 1];
            }
            else
            {
               Growing1[i] = Values[i];
               Growing1[i + 1] = Values[i + 1];
            }
         }
      }
      // if the last value does not grow, remove it
      else if (i == 0)
      {
         if (Growing1[i + 1] != EMPTY_VALUE && Growing1[i + 2] == EMPTY_VALUE)
         {
            Growing1[i + 1] = EMPTY_VALUE;
         }

         if (Growing2[i + 1] != EMPTY_VALUE && Growing2[i + 2] == EMPTY_VALUE)
         {
            Growing2[i + 1] = EMPTY_VALUE;
         }
      }
   }

   return(0);
}
3.4.4. Automation
The same task solution by using the Indicator_Painting library.
In the library there is also similar implementation for downward direction.
//|                                 RSI_Directions_Lib_Sample.mq4 |

#include <Indicator_Painting.mqh>

extern int RSIPeriod       = 9;
extern int AppliedPrice    = 0;

// buffers
double Values[];           // Values
double Growing1[];         // First growing buffer
double Growing2[];         // Second growing buffer

int DigitsUsed = 5;
int EmptyValueUsed = 0;

int start()
{
   int toCount = Bars - IndicatorCounted();

   // Reading values
   for (int i = toCount - 1; i >=0; i--)
   {
      Values[i] = NormalizeDouble(iRSI(Symbol(), 0, RSIPeriod, AppliedPrice, i), DigitsUsed);
   }

   // Mark the growing levels - we will get the falling levels automatically
   MarkGrowing(Values, Growing1, Growing2, toCount - 1, 0, EmptyValueUsed);

   return(0);
}
4. The Indicator_Painting Library
As a result of all of the work completed there is an Indicator_Painting library.
It has been designed specially for automation of the operations described, with some additions.
Here is a list of available functions:
// ====================================================
// Mark for tops and bottoms
// ====================================================
void MarkExtremums(
      double values[],        // Indicator values
      double& extremums[],    // Buffer for extremums
      int startIndex,         // Start index for check (it included)
      int endIndex,           // End index for check (it included)
      int direction,          // DIR_TOP for tops, DIR_BOTTOM for bottoms, DIR_ALL for tops an bottoms
      double emptyValueUsed); // The value used for "empty" mark


// ====================================================
// Mark for crosses
// ====================================================
void MarkCrosses(
      double values1[],       // Values of the first indicator
      double values2[],       // Values of the second indicator
      double& crosses[],      // Buffer for their crosses
      int startIndex,         // Start index for check (it included)
      int endIndex,           // End index for check (it included)
      int direction,          // CROSS_UP for up crosses,CROSS_DOWN for down crosses, CROSS_ALL for all crosses
      double emptyValueUsed); // The value used for "empty" mark


// ====================================================
// Mark for level crosses
// ====================================================
void MarkLevelCrosses(
      double values[],        // Values of the indicator
      double level,           // Level value for a cross check
      double& crosses[],      // Buffer for the crosses
      int startIndex,         // Start index for check (it included)
      int endIndex,           // End index for check (it included)
      int direction,          // CROSS_UP for up crosses,CROSS_DOWN for down crosses, CROSS_ALL for all crosses
      double emptyValueUsed); // The value used for "empty" mark


// ====================================================
// Mark for levels
// ====================================================
void MarkLevel(
      double values[],        // Values of the indicator
      double& level[],        // Buffer for the crosses
      int startIndex,         // Start index for check (it included)
      int endIndex,           // End index for check (it included)
      double levelValue,      // Level value
      int condition,          // Mark condition (LESS_THAN = -1, GREATER_THAN = 1)
      double emptyValueUsed); // The value used for "empty" mark

// ====================================================
// Mark for dynamic levels
// ====================================================
void MarkDynamicLevel(
      double values[],        // Values of the indicator
      double dynamicLevel[],  // Dynamical level values for check
      double& level[],        // Buffer for the crosses
      int startIndex,         // Start index for check (it included)
      int endIndex,           // End index for check (it included)
      int condition,          // меньше (LESS_THAN = -1) или больше уровня (GREATER_THAN = 1)
      double emptyValueUsed); // The value used for "empty" mark

// ====================================================
// Mark for direction (upward)
// ====================================================
void MarkGrowing(
      double values[],        // Values of the indicator
      double& growing1[],     // The first buffer to mark the direction
      double& growing2[],     // The second buffer to mark the direction
      int startIndex,         // Start index for check (it included)
      int endIndex,           // End index for check (it included)
      double emptyValueUsed); // The value used for "empty" mark

// ====================================================
// Mark for direction (downward)
// ====================================================
void MarkReducing(
      double values[],        // Values of the indicator
      double& reducing1[],    // The first buffer to mark the direction
      double& reducing2[],    // The second buffer to mark the direction
      int startIndex,         // Start index for check (it included)
      int endIndex,           // End index for check (it included)
      double emptyValueUsed); // The value used for "empty" mark
Here are some examples of the library use:
In order to use the library the following should be done:
1. Copy the file "Indicator_Painting.mq4" to folder "experts/libraries"
2. Copy the file "Indicator_Painting.mqh" to folder "experts/include"
3. Add the following string to the indicator code:
#include <Indicator_Painting.mqh>
Now it is possible to use all of the library functions. See the file "Indicator_Painting.mqh" for details.
You can find the examples in the files attached to the article.
Conclusion
The author hopes that this article will help and simplify the work of some people. The author considers the aim achieved.
Acknowledgments
The author would like to thank Mr. Viktor Rustamov (granit77) for the task suggestion, help and comments to improve the article.
Translated from Russian by MetaQuotes Ltd.
Original article: https://www.mql5.com/ru/articles/1569
 Auto-Generated Documentation for MQL5 Code
 Working with Doubles in MQL4
 Step on New Rails: Custom Indicators in MQL5
 Interaction between MеtaTrader 4 and MATLAB Engine (Virtual MATLAB Machine)
- Free trading apps
- Over 8,000 signals for copying
- Economic news for exploring financial markets
You agree to website policy and terms of use
That's exactly what I was looking for since days.
Finally I found this article. Thanks a lot :)