
Social Trading. Can a profitable signal be made even better?

Introduction
Since the origin of social trading, people have been trying to use it: Some to learn how to trade from more experienced traders in real conditions, others to get profits without going into the subtleties of manual trading. A separate swath of specialists has appeared who deal with trade signals in a professional manner. When choosing a signal provider, we want that it ensures our highest profits at a long time interval, has many subscribers, and ranks among top in ratings. At the same time, the number of subscribers only increases, if the balance curve demonstrates stable growth without any significant visible drawdowns.
As a result, it is often the case that the main goal of your provider is not to generate a high-quality signal, but to increase the number of its subscribers. However, let us take a more reflective approach. It may well be that both top signals and even middle-ranked signals can be enhanced significantly and made even more helpful for users. However, this requires that you know what to focus on and what can be cut off mercilessly. Therefore, this paper may be foremost useful for signal providers. Nevertheless, discerning subscribers can also get something valuable out of that.
This paper is aimed at testing the hypothesis of whether the signal performance and reliability can be enhanced without sacrificing the preset risk levels, if some filters are used. Unfortunately, the functions of filters to be discussed below are not available to the "Signals" service subscribers. However, the signal provider can realize them by having set monitoring for individual tools and using additional indicators. Having taken into account the information presented here, a provider can take a critical approach to question of on which symbols, how and when to trade to enhance both the performance and reliability of your trading and, therefore, the attractivity of the signal for most subscriber subgroups.
What is the premise for a signal to be popular?
Very many newbie providers ask that question.
Logically, the main purpose of a provider must be the signal risk/profitability ratio. Number of subscribers is just a consequence, a sign of a high-quality signal. Customers subscribing for a signal often consider the balance curve only. They fail to realize that, in trading, the provider may widely vary risks and play with depositing and withdrawing funds to make the line appear as attractively as possible. Few of subscribers bother with checking up on what means and methods are used to achieve the results shown. All in all, at certain moments, the risks on the subscriber's account may multiply. This may fatally affect the account balance. The above manipulations are harmful for both the subscribers and their providers, and for the service as a whole, since such incidents damage its credibility and undermine its authority.
Each provider must keep in mind that a high-quality signal is most important. At the same time, a signal must by no means be madly profitable or demonstrate a three-digit profit per month. In my opinion, a high-quality signal characterizes both the stability of profits and the stability of risks. Naturally, it is difficult to find a happy medium within the fork between stable profits and stable risks. However, this is exactly what makes a signal reliable. I am not taking the human factor into account, of course, where one breaks his or her own rules, which strikes all the preceding efforts. You should always keep in mind: Trading requires harsh discipline and total dedication.
There are traders who select signals strictly and judiciously. They perform a comprehensive analysis of parameters and study all the details of trading history. However, there are not many of them. Respectively, since demand begets supply, there are few signals that would comply with the requirements of skilled investors. A self-supporting tendency turns out to be: Most signals are intended for the unskilled audience of subscribers. Such subscribers are mainly interested in the historical profitability and in the gain slope of the balance line, not in the method it has been achieved by.
An ideal signal means relatively stable profits at a stable risk level.
However, life is life, and this is hardly affordable in real trading. Sooner or later, the market uncertainty factor will come into play, and a series of profitable trades will be interrupted with losing ones. A signal provider faces the challenge: How to remedy the situation and compensate for the losses incurred. There are two options.
- The first one is to perform the subsequent trades with the lot sizes that exceed normal ones by an order of magnitude (in other words, use martingale). Here we can hope that the trades will be profitable and both cover the losses and take the total balance to a new level.
- The second one is to try and preselect the moment where the EA settings are irrelevant to the current state of the market. Then you should either re-optimize the product or reduce the risks to reduce possible drawdown, or move the traded objects onto another symbol showing a more acceptable result. If there are several symbols traded, then the task becomes much easier, especially if funds are limited for each of them, and a drawdown on one symbol will not cause any fatal changes in the account as a whole.
Experience has proven that most providers choose the first option. However, not every subscriber has an account that can endure a sharp increase in lot sizes. The purpose of using martingale is normally only one, namely to quickly flatten off the balance, in case of drawdowns. Somebody manages to do so for quite a while. However, luck cannot be never-ending. Under this approach, going flop is just a matter of time.
Perhaps, the fastest and easiest way to find out about the credibility level of a signal is to look at lot size changes. If the increment chart is flawless and this is achieved by stable trade lot sizes (if even with a certain smooth increase), then it would be reasonable to have a closer look at it. If, in contrast, the chart is beautiful with the trading lots differing from each other hugely from trade to trade, then the signal reliability is doubtful. Because rapid increase in lot sizes is the direct separation from the risk management policy. This involves serious troubles, if the provider does not "guess" the right signal in one of its large trades.
How can the signal efficiency be improved?
The concept of diversification is known by any active trader. It is a trick, which supposes trading on several (at least three) symbols. This is how we reduce our dependence on the market situation for a symbol. This is especially topical where the settings of your EA or trading system start glitching. This is usually manifested in increasing amounts of losing trades performed on false signals. The probability of the settings to become irrelevant to all symbols simultaneously is very low. Which is bad for one asset is good for another one. Therefore, diversification may help achieve some stability for your deposit and trading results.
Study trading results for each symbol separately — and you will know whether your settings need being adjusted or not. Below I'm describing an example of how to analyze the results. It can make it clear to a trader how to work with his or her settings, in what direction, and on which symbols. It is quite conceivable that some symbols should be completely excluded from your trading portfolio.
If we take a serious approach to this matter and analyze individual figures of the trades performed by the provider, then the number of noteworthy signals will reduce still more. The reason for that is simple: A beautiful balance curve, in most cases, is achieved through "outstaying" the temporarily losing positions and covering the losses due to significant increase in the lot size of the next trade. Therefore, to see how stably a provider trades and how sound its trade signals are, you should better assess their history without considering the lot sizes. This trick simulates trading with stable risks.
Why is it important to know the behavior of a balance curve in points? It's simple: If the balance in points increases, then playing with lot sizes won't be harmful; it would rather make the balance in money growing exponentially. Vice versa, the negative balance in points alerts you that something is wrong with your trading system rules or your EA settings and that you should better take measures.
How to find best symbols and sort the wheat from the chaff?
We should understand what makes signal better and what worsens it. For this purpose, we will consider trade history in terms of symbols, on which the trades were made, as well as in terms of their opening directions.
If a provider trades on several symbols simultaneously, the settings or even timeframes are set individually for each symbol. The results of trading under one strategy, but on different symbols can differ from each other quite a bit. The main profits are often gained due to trading on one or two symbols. At the same time, there can be symbols in the portfolio, which weight down the total statistics drastically. However, given the plenty of trades, the provider usually only pays attention to the total outcome. Not until the total balance starts demonstrating a negative tendency, it starts studying data in more details. In the online chart, you can track the moments where trades on one symbol or another become irrelevant. A logical conclusion: Risks on such trades must be reduced by decreasing lot sizes of your trades.
As an example for analysis, we are going to use the data on one of the "longest-running" signals. Its statistics starts in March, 2014.
The data will be analyzed as follows.
To start with, we are going to prepare a file of trades that we will download from the official signal page. Then we will sort the data by three criteria: Symbol, Trade Direction, and Trade Opening Date. Upon that, we will start consider the trades by symbol and by direction. As I wrote above, along with the data on profits/losses in the account currency, I will also analyze the performance of trades in points (as in trading with a fixed lot size), as well as the changes in the lot sizes of the trades.
The values of lot sizes and of balance in points were normalized to look proportionally in the general chart.
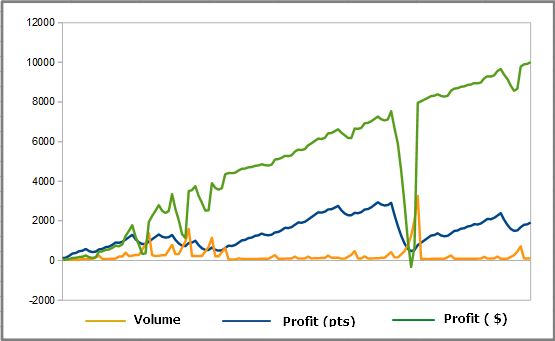
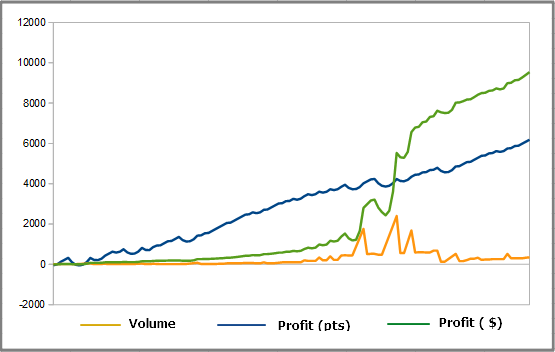
AUDCAD - BUY
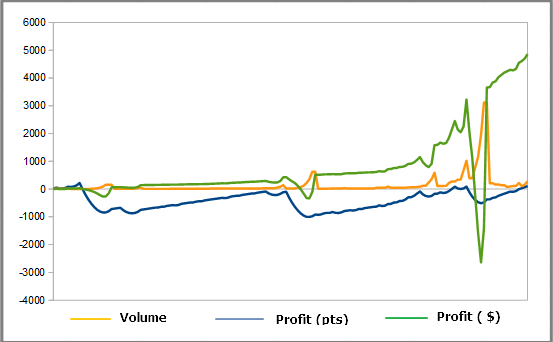
The chart above presents the statistics of trades on AUDCAD in the Buy direction. The green line representing the balance changes in the account currency grows practically exponentially, if the recent drawdown is not taken into consideration. By the way, that drawdown was caused by the fact that the lot sizes of the trades exceeded by multiples those made the day before (this is shown by the yellow line that represents the changes in lot sizes). The provider went out of that drawdown due to a significant increase in the lot sizes of trades, which means due to a proportional increase in risks. One might as well say that the provider had luck and its trades with extremely high lot sizes had finally turned out to be profitable. It's hard to imagine what would happen to the deposit, if fortune were less favorable to it. Please also note the blue line that represents the statistics on trades without considering their lot sizes. It is within the negative area, and the signals are basically losing, while the profitability of the trades on that symbol is only achieved due to playing with lot sizes.
What can be recommended to the provider in trading on this symbol? Revise the settings of the EA or improve on the rules, if trading is manual.
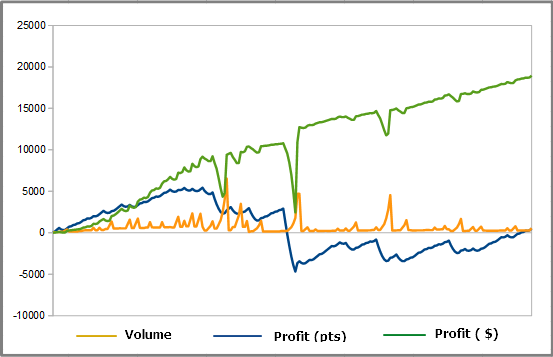
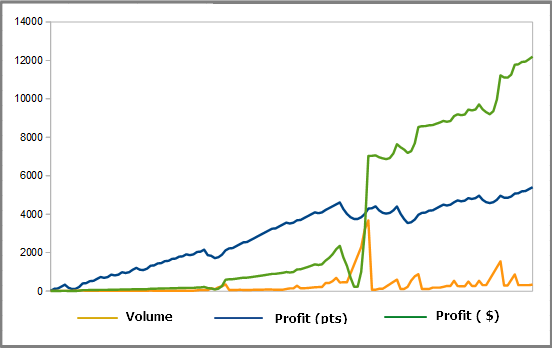
AUDCAD - SELL
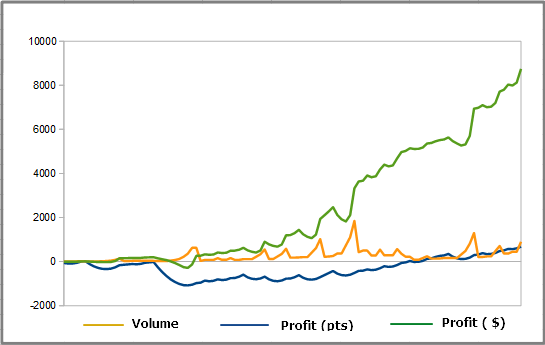
The chart above presents the statistics of trades on AUDCAD in the Sell direction. Here, playing with lot sizes is not so pronounced as in the previous case. Moreover, the signal quality, that is, the changes in trades with fixed lot sizes within the last three fourths of history are positive. This leads to the exponential growth of changes in the balance on the symbol, expressed in the account currency. In the chart, we can see that high-quality signals supported by playing with lot sizes can work like magic.
In general, trading on АUDCAD with settings in the SELL direction obviously looks more preferable.
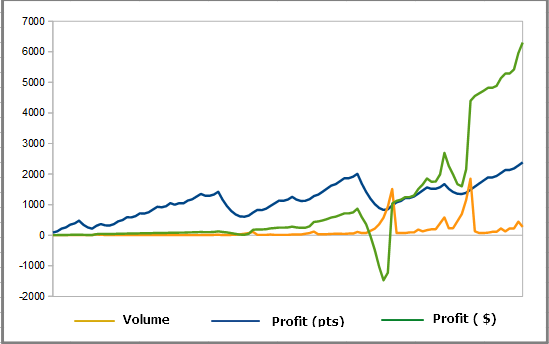
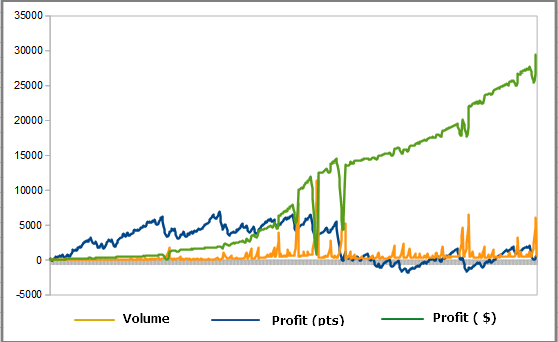
AUDNZD - BUY
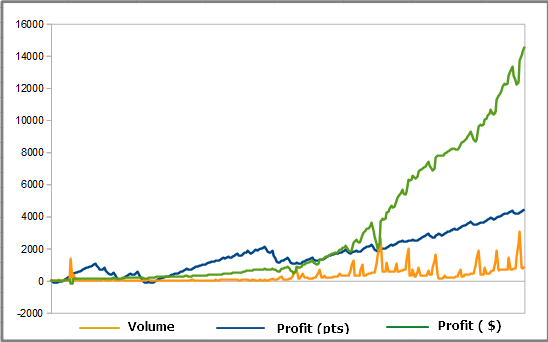
The chart above presents an example where the statistics of trades in points initially shows positive changes and, when enriched with effectively playing with lot sizes, demonstrates the exponential growth of the balance in the account currency. Moreover, playing with the lot sizes of trades does not look so risky.
However, there is no question of any stable risk levels.
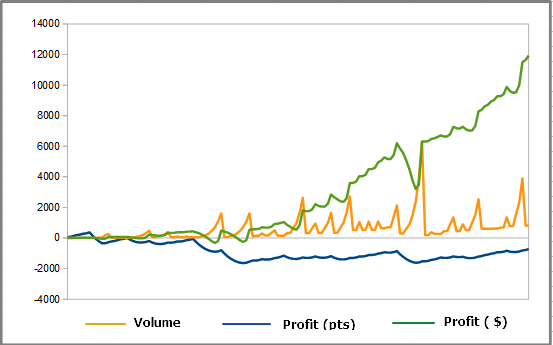
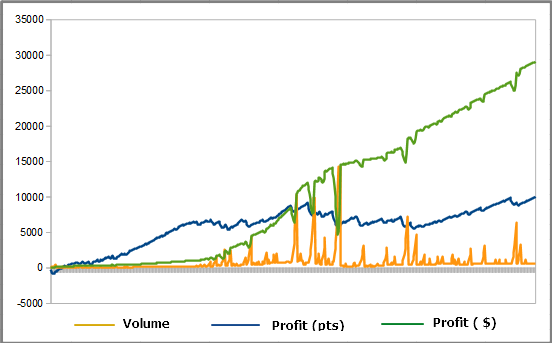
AUDNZD - SELL
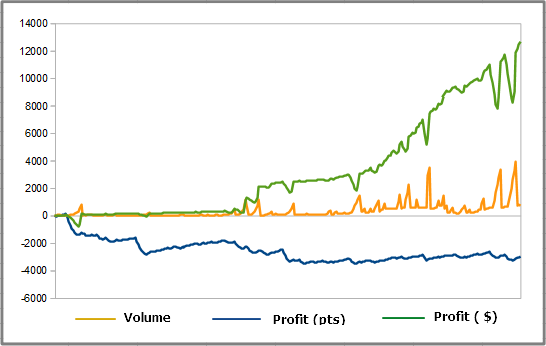
Can good playing with lot sizes improve the performance of a losing trading system? Based upon the chart above, definitely, yes. Balance on this symbol is growing due to luckily playing with lot sizes only. Trading with a fixed lot size would be losing, since the general quality of the signal is negative (see the blue line).
In my opinion, this play is being made on slippery ground. If the trader's luck doesn't hold, a deep drawdown is inevitable. Recommendation: Revise the settings for this symbol in the SELL direction.
EURGBP - BUY
Pay attention to the areas where the signal quality (the blue line) is high and the changes in trading with a fixed lot size ensures stable growth. Now imagine a situation where the signal quality starts decreasing, and the provider does not increase the lot size, but reduces it to minimum. Then you could avoid deep drawdowns on the balance in the account currency and, most important, minimize extreme risks taken by the trader to cover the losses incurred.
EURGBP - SELL
Data on EURGBP - SELL shows that the money balance in the first half of history grows due to extremely playing with lot sizes at drawdowns. However, in the second half, the quality of trades with fixed lot sizes started showing positive changes (the blue line grows) and there is no need for playing with lot sizes anymore.
EURSGD - BUY
An illustrative example of what the excessively increasing the lot sizes may lead to at drawdowns. The generally satisfactory signal (the blue line is within the positive area) moved into the losing area.
EURSGD - SELL
When trading on this symbol, it wouldn't hurt the provider to revise the settings. The general signal quality is unsatisfactory (the blue line is within the negative area). It is an extremely risky symbol when largely playing with lot sizes.
GBPCAD - BUY
GBPCAD - SELL
The examples above present an ideal signal. Very high quality of trades and successfully playing with lot sizes — all this makes the signal extremely attractive. If the rules of the Signals service allowed subscribing for signals on individual symbols, I would do that with pleasure. Settings are very relevant. GBPCAD is the most favorable symbol from the entire portfolio traded by this provider.
No comments on the next two examples: I think the methods are generally clear and you will be able to analyze them yourselves.
NZDCAD - BUY
To top it off: A balance indicator
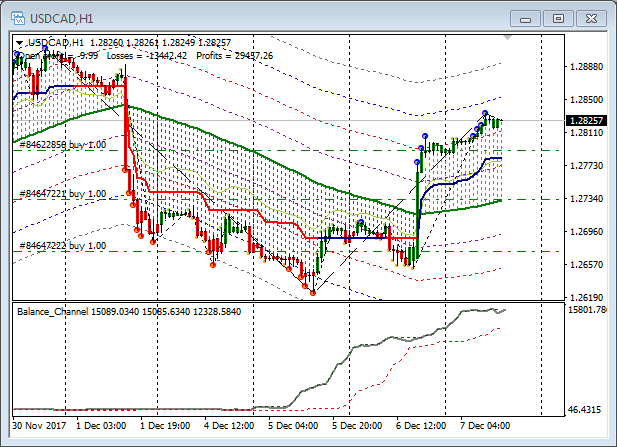
To track the results on individual symbols in the real time mode, you can use a specially designed balance indicator that shows the account statistics graphically.
It can be shown both for the account as a whole and for an individual symbol, and for the individual direction of Buy/Sell trades. This valuable information will help you find a weak point in your trading. You will see much in evidence, trades on which symbols and in what direction are the most profitable, and which symbols weigh the total balance down. The last section of the balance curve represents a floating profit/loss on open positions, so you can observe in the real time mode, what the current state of your open positions is as related to the preceding result.
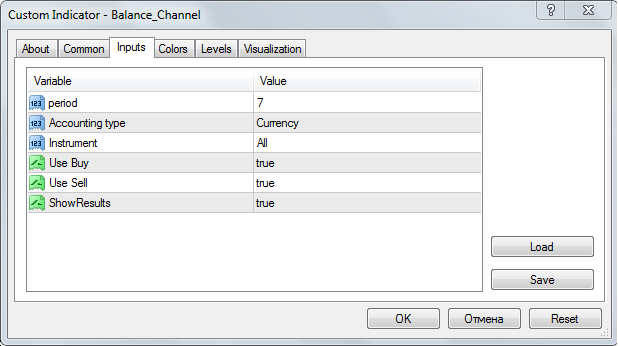
Description of Parameters
- Period defines the price range for the balance line, similarly to indicator PriceChannel
- Calculate type — balance line calculation mode: In the deposit currency (= Currency) or in points ("= Points").
- Instrument — parameter for calculating on a symbol. If "= Current", then the results are only calculated for the current chart symbol. If "= All", then trades on all symbols are calculated, considering swaps and commissions.
- Use Buy — setting up the direction of trades. If "= true", then Buy trades are calculated. If "= false", the Buy trades are excluded from calculations.
- Use Sell — setting up the direction of trades. If "= true", then Sell trades are calculated. If "= false", the Sell trades are excluded from calculations.
- ShowResults — showing the results. For "= true", the following results will be shown in the main chart: Profit/Loss on open positions (OpenProfit), the total amount of losses (Losses), and the total amount of profits (Profits). For "= false", the final figures are not shown in the chart.
One of the options to use this indicator: If the lower boundary of the price channel is broken through by the balance curve, the it is considered a signal of starting the negative scenario. Stably negative changes in the balance curve in the account currency provide information on a general decrease in the quality of trades. It means that it is time to hugely reduce the lot sizes, down to using those as minimal as possible. Where the balance curve of the symbol selected updates the upper boundary, you can think of returning to trading with your traditional lot sizes, but only within the framework of your risk management policy.
At the same time, negative changes in the balance curve in points say for the need for changing the EA settings or the indicators used to improve the quality of opening/closing signals. This is a serious reason to check to what extent the parameters of your indicators or your EA settings are relevant to the current state of the market.
Conclusion
Recommendations for subscribers. It is not worth the trouble to hastily rely on beautiful balance lines that grow fast and without any visible drawdowns. In real life, everything is much more boring and prosaic.
Recommendations for providers. Analyze trading results thoughtfully. Analyze every symbol traded in all details. Reasonably exclude trades on the symbols having obviously low quality or perform them with a minimum lot size (in order not to interrupt the statistical array). In this manner, you can significantly enhance the profitability and simultaneously reduce risks. Today, most signal providers achieve growing profitability by playing with lot sizes of their trades, i.e., by extremely increasing the risks. However, it would be ideal to enhance profitability by aiming for increasing the quality of your trades at stable risks.
Separately monitoring the statistics on symbols and trade directions also provides information on when to re-optimize the settings. At the same time, you do not optimize for all symbols at once, but only for those that really require that.
I hope this information would help providers see trading in a new light and offer really high-quality signals to their subscribers.
Translated from Russian by MetaQuotes Ltd.
Original article: https://www.mql5.com/ru/articles/4191
 Improving Panels: Adding transparency, changing background color and inheriting from CAppDialog/CWndClient
 Visual strategy builder. Creating trading robots without programming
 How to analyze the trades of the Signal selected in the chart
- Free trading apps
- Over 8,000 signals for copying
- Economic news for exploring financial markets
You agree to website policy and terms of use
Thanks Mr. Rustem Bigeev. This article is enough for the any wise subscribers..!!
There are Signal Providers and there are Signal providers. Most subscribers are still preys to the ways many Signal Providers.