How to detect trends and chart patterns using MQL5

Introduction
As traders, we all deal with charts and try to read them correctly to be able to have an edge in understanding different scenarios that may happen in the price action to take the right decision. Because the chart contains many patterns that can appear which are helpful to predict a potential price movement if we realized them. So, if we have useful tools that can help us to do that easily and accurately I believe that it will be a good thing. In this article, I will try to provide some helpful tools in this context as I will provide how we can detect something that appears on the chart which price patterns that we all need to read, these patterns are the same as trends or chart patterns that can be formed by the price action.
We will cover that through the following topics:
- Highs and lows detection
- Trends detection
- Chart double tops detection
- Chart double bottoms detection
- Conclusion
After reading this article, you will be able to detect highs and lows, identify trend types, double tops, and bottoms accordingly. So, you have to try writing mentioned codes by yourself and you must test and develop what you need to get better insights and results before using it for your real account. The main objective of this article is to understand the main idea of detecting highs and lows and chart patterns to develop your code more and more to detect what you need of known or unknown significant patterns as there are many meaningful patterns that can be seen on the chart that can be a game changer for your trading if you understand how to benefit from them.
We will use in this article the MQL5 (MetaQuotes Language) IDE which is built-in in the MetaTrader 5 trading terminal. If you do not know how to use MQL5 and you want to learn how to download the MetaTrader 5 and use the MQL5 to write codes, you can read the Writing MQL5 code in MetaEditor topic from my previous article.
Highs and Lows detection
In this part, we will start by detecting highs and lows on the chart by MQL5 then we will use this as a base to declare our conditions as per each chart pattern. First, as we all know definitions of highs and lows as below:
Highs:
High means that there was an up movement to a specific level because of the strength of buyers then the seller appears and pushed the price down from this high level. The following figure is an example.

Lows:
Low means that there was a downward movement to a specific level because of the strength of sellers then the buyer appears and pushed the price up from this low level. The following figure is an example.

After identifying these two important price levels we need to create an MQL5 program or Expert Advisor that can detect these types of movements. There are many methods that can be used to do that and we will provide one of these methods through the following lines.
We need to determine specific price levels (high and low) then we will go toward other specific price levels (high and low) and compare high to high and low to low to determine if we have another high or low. To do that, we need to go through specific steps the same as the following.
Create a function out of the OnTick() scope to return the high or low. We will name it (getNextMove) as an integer variable and the parameters that we need to set for this function are:
- Int move: to determine the move if it is high or low.
- int count: to determine the count related to the startPos variable.
- int startPos: to determine the starting position that we need to start from.
int getNextMove(int move, int count, int startPos)
Inside this function we need to do the following check by using the if statement to identify the value of the function parameters, we need to check if the (startPos) is smaller than zero we need to add the startPos value to the count value and update startPos with zero value to start from the current bar.
   if(startPos<0)
     {
      count +=startPos;
      startPos =0;
     }
Now, we identified (count) and (startPos) variables in the function. The (move) variable will be identified in the returned value by using the return operator which terminates the function execution and returns the move value and using the ternary operator (?:) which consists of three expressions, the first one returns bool type of data and if it is true the second expression will be executed and if it is false the third expression will be executed.
So, we will specify if the move variable is equal to high in the first operator, and if it is true, the highest value will be returned which is the (High) and if it is false, the lowest value will be returned which is the (Low).
For checking if the move is high we will use the MODE_HIGH functions which is one of the time series identifiers that is used in the iHighest() and iLowest() functions to return the high price. For parameters of iHighest, and iLowest functions to return the index of the highest and lowest value the following is for them:
- symbol: we will use Symbol() to return the current symbol name as a const string.
- timeframe: we will use Period() to return the current time frame as an ENUM_TIMEFRAMES.
- type: we will use (ENUM_SERIESMODE) move to return the move type as a time series identifier. This type will the high for the iHighest and low for the iLowest.
- count: we will use the integer (count) variable to return the number of elements.
- start: we will use the integer (startPos) variable to return the index.
   return((move==MODE_HIGH)?
          iHighest(Symbol(),Period(),(ENUM_SERIESMODE)move,count,startPos):
          iLowest(Symbol(),Period(),(ENUM_SERIESMODE)move,count,startPos));
After creating this function that will return the next move we will create another integer function that will be the main one to get high or low of the current move. Its name will be (getmove) with three integer variables as parameters (move, count, and startPos)
int getmove(int move, int count, int startPos)
Inside this function we need to check if the move does not equal the MODE_HIGH or MODE_LOW the returned value will be (-1).
if(move!=MODE_HIGH && move!=MODE_LOW)
      return (-1);
Creating a new integer (currentBar) variable and assigning the (startPos) to it.
int currentBar=startPos; Creating a new integer (moveReturned) variable and assigning the getNextMove created function to it with the following parameters (move, (count*2+1), currentBar-count)).
int moveReturned=getNextMove(move,count*2+1,currentBar-count);
Create a loop by using While as we need to check an expression and if it is true the operator will be executed. Here the expression that we need to check is if the moveReturned does not equal the currentBar and if it is true the operators that we need to be executed are:
- Updating the (currentBar) variable with the getNextMove with parameters of (move, count,currentBar+1).
- Updating the (moveReturned) variable with the getNextMove with parameters of (move,count*2+1,currentBar-count).
   while(moveReturned!=currentBar)
     {
      currentBar=getNextMove(move,count,currentBar+1);
      moveReturned=getNextMove(move,count*2+1,currentBar-count);
     }
Then use the return function to terminate the function by returning the currentBar value
return(currentBar); Then, we will go inside the OnTick() and call what helped to detect highs and lows. the first thing we will create three integer variables
   int checkBars= 5;
   int move1;
   int move2;
Updating move1 and move2 with our pre-created getmove function with parameters (MODE_HIGH,checkBars,0) for move1 and (MODE_HIGH,checkBars,move1+1) for move2 to detect the two highs
   move1=getmove(MODE_HIGH,checkBars,0);
   move2=getmove(MODE_HIGH,checkBars,move1+1);
Create a line object above these two high by the following steps:
Deleting any existing line by using the (ObjectDelete) which removes an object with a name. There are parameters for this function the first one is chart_id to determine the chart identifier and we will use 0 for the current chart. The second parameter is the name to determine the object name we will use topLine as a string.
ObjectDelete(0,"topLine");
Creating a new topLine object by using the ObjectCreate function which creates an object with a new. Its parameters are:
- chart_id: we will use (0) to return a long type as a chart identifier.
- name: we will use "topLine" to return a string type as the name of the object.
- type: we will use OBJ_TREND to return an ENUM_OBJECT type or the object type.
- nwin: we will use (0) for the current chart as a window index.
- time1: to determine the time of the move2 anchor and return datetime type, we will use iTime(Symbol(),Period(),move2)
- price1: to determine the price of the move2 anchor and return double type, we will use iHigh(Symbol(),Period(),move2).
- timeN=0: to determine the time of the move1 anchor and return datetime type, we will use iTime(Symbol(),Period(),move1).
- priceN=0: to determine the price of the move1 anchor and return double type, we will use iHigh(Symbol(),Period(),move1).
As we can see the iHigh function returns the high price of the bar and its parameters are symbol, timeframe, and shift. the iTime function returns the opening time of the bar and its parameters are the same as the iHigh function.
ObjectCreate(0,"topLine",OBJ_TREND,0,iTime(Symbol(),Period(),move2),iHigh(Symbol(),Period(),move2),iTime(Symbol(),Period(),move1),iHigh(Symbol(),Period(),move1));
Setting a color, specific width, and type of line for this created object by using the ObjectSetInteger function. Its parameters are:
- chart_id: to determine the chart identifier and it will be (0).
- name: it is for the object name, it will be "TopLine" for highs.
- prop_id: to determine the object property, it will OBJPROP_COLOR for color, OBJPROP_WIDTH for width, and OBJPROP_RAY_RIGHT for the type of line.
- prop_value: to determine the desired value, it will be clrRed for the color, 3 for the width, and true for the type of line.
   ObjectSetInteger(0,"topLine",OBJPROP_COLOR,clrRed);
   ObjectSetInteger(0,"topLine",OBJPROP_WIDTH,3);
   ObjectSetInteger(0,"topLine",OBJPROP_RAY_RIGHT,true);
Getting the two lows by updating the move1 and move2 variables the same as we did for the highs but the mode will be MODE_LOW as a time series identifier.
   move1=getmove(MODE_LOW,checkBars,0);
   move2=getmove(MODE_LOW,checkBars,move1+1);
Deleting and creating the line object below these two lows is the same as what we did for highs but some differences in the name of the object as it will be "bottomLine" and the green color.
   ObjectDelete(0,"bottomLine");
   ObjectCreate(0,"bottomLine",OBJ_TREND,0,iTime(Symbol(),Period(),move2),iLow(Symbol(),Period(),move2),iTime(Symbol(),Period(),move1),iLow(Symbol(),Period(),move1));
   ObjectSetInteger(0,"bottomLine",OBJPROP_COLOR,clrGreen);
   ObjectSetInteger(0,"bottomLine",OBJPROP_WIDTH,3);
   ObjectSetInteger(0,"bottomLine",OBJPROP_RAY_RIGHT,true);
The following is for the full code in one block of code:
//+------------------------------------------------------------------+
//|                                                   moveFinder.mq5 |
//|                                  Copyright 2023, MetaQuotes Ltd. |
//|                                             https://www.mql5.com |
//+------------------------------------------------------------------+
#property copyright "Copyright 2023, MetaQuotes Ltd."
#property link      "https://www.mql5.com"
#property version   "1.00"
//+------------------------------------------------------------------+
void OnTick()
  {
   int checkBars= 5;
   int move1;
   int move2;
   move1=getmove(MODE_HIGH,checkBars,0);
   move2=getmove(MODE_HIGH,checkBars,move1+1);
   ObjectDelete(0,"topLine");
   ObjectCreate(0,"topLine",OBJ_TREND,0,iTime(Symbol(),Period(),move2),iHigh(Symbol(),Period(),move2),iTime(Symbol(),Period(),move1),iHigh(Symbol(),Period(),move1));
   ObjectSetInteger(0,"topLine",OBJPROP_COLOR,clrRed);
   ObjectSetInteger(0,"topLine",OBJPROP_WIDTH,3);
   ObjectSetInteger(0,"topLine",OBJPROP_RAY_RIGHT,true);
   move1=getmove(MODE_LOW,checkBars,0);
   move2=getmove(MODE_LOW,checkBars,move1+1);
   ObjectDelete(0,"bottomLine");
   ObjectCreate(0,"bottomLine",OBJ_TREND,0,iTime(Symbol(),Period(),move2),iLow(Symbol(),Period(),move2),iTime(Symbol(),Period(),move1),iLow(Symbol(),Period(),move1));
   ObjectSetInteger(0,"bottomLine",OBJPROP_COLOR,clrGreen);
   ObjectSetInteger(0,"bottomLine",OBJPROP_WIDTH,3);
   ObjectSetInteger(0,"bottomLine",OBJPROP_RAY_RIGHT,true);
  }
int getmove(int move, int count, int startPos)
  {
   if(move!=MODE_HIGH && move!=MODE_LOW)
      return (-1);
   int currentBar=startPos;
   int moveReturned=getNextMove(move,count*2+1,currentBar-count);
   while(moveReturned!=currentBar)
     {
      currentBar=getNextMove(move,count,currentBar+1);
      moveReturned=getNextMove(move,count*2+1,currentBar-count);
     }
   return(currentBar);
  }
int getNextMove(int move, int count, int startPos)
  {
   if(startPos<0)
     {
      count +=startPos;
      startPos =0;
     }
   return((move==MODE_HIGH)?
          iHighest(Symbol(),Period(),(ENUM_SERIESMODE)move,count,startPos):
          iLowest(Symbol(),Period(),(ENUM_SERIESMODE)move,count,startPos));
  }
After compiling this code without errors and executing it we can get two lines on the chart to detect two highs with a red line above them and two lows and a green line below them. The following are examples from testing:

As we can see in the previous example that these two lines can show a pattern on the chart also to indicate the movement of the price, we can see in the previous one that we have a sharp up move as we have two upward lines and the angle of the upper one is wider than the lower one. So, they can be a very useful tool to interpret the price action.
The following is another example with a different pattern according to a different price action:

The same as we can see on the previous chart that we have a different price action indicating a different movement as we have the two line does move in parallel but have the lower line moves upward and the upper line moves downward indicating there is a balance between buyer and seller as buyers push the price higher and sellers at the same time push the price lower.
The following is an example of another pattern of price action also:

As we can see in the previous chart we have a different chart pattern as we have two parallel downward lines that can indicate the strength of sellers as they are able to push prices lower.
Trends detection
After learning how we can detect highs and lows on the chart in the previous part, we can develop this code to detect trends on the chart because we detected two highs and two lows and this is what we need to identify the trend. The following in this part of this article is about developing our previous code to detect trends on the chart in its three types as much as possible by the previous code with some differences.
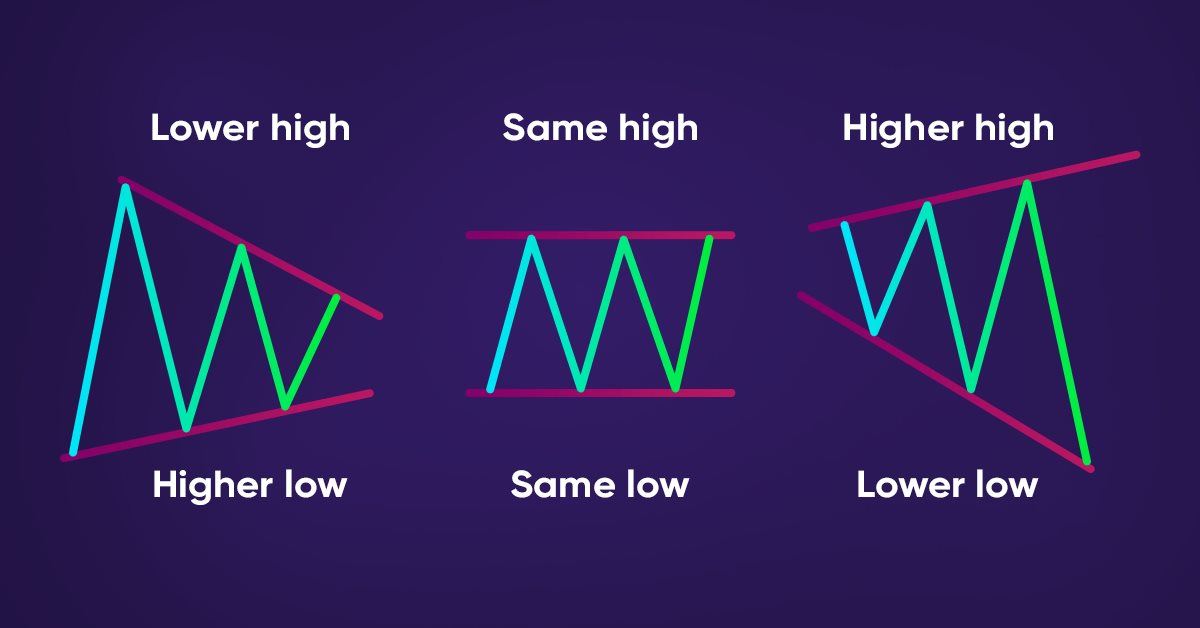
Simply, trends are the movement of the price action and this movement can be upward, downward, or without clear direction neither up nor down. and these are three types of trends the same as the following:
Uptrend:
This type of price movement results that prices continuing to move upward achieving higher prices as buyers are the strong party according to this type in the market. So, we can find on the chart that the price forms higher lows and higher high clearly. The following figure is a graph for this type:

Downtrend:
This type of trend is the opposite scenario of the uptrend type as in this downtrend type sellers are stronger than buyers and pushes prices down achieving lower price. So, we can see on the chart that prices form lower highs and lower lows.
The following is a graph to describe it from a visual perspective:

Sideways:
In this type, we cannot find a price movement that can be described as an uptrend or downtrend. So, this type is any form except uptrend or downtrend and it has many forms and following figures are some of these forms:


Now, we need to create an MQL5 EA that can detect if we have a trend (up or down) or if we have no trend (sideways). The following code is to create this type of EA:
//+------------------------------------------------------------------+
//|                                                  trendFinder.mq5 |
//|                                  Copyright 2023, MetaQuotes Ltd. |
//|                                             https://www.mql5.com |
//+------------------------------------------------------------------+
#property copyright "Copyright 2023, MetaQuotes Ltd."
#property link      "https://www.mql5.com"
#property version   "1.00"
//+------------------------------------------------------------------+
void OnTick()
  {
   int checkBars= 5;
   int high1, high2, low1, low2;
   double highVal1, highVal2, lowVal1, lowVal2;
   high1=getmove(MODE_HIGH,checkBars,0);
   high2=getmove(MODE_HIGH,checkBars,high1+1);
   highVal1=NormalizeDouble(iHigh(_Symbol,_Period,high1),5);
   highVal2=NormalizeDouble(iHigh(_Symbol,_Period,high2),5);
   ObjectDelete(0,"topLine");
   ObjectCreate(0,"topLine",OBJ_TREND,0,iTime(Symbol(),Period(),high2),iHigh(Symbol(),Period(),high2),iTime(Symbol(),Period(),high1),iHigh(Symbol(),Period(),high1));
   ObjectSetInteger(0,"topLine",OBJPROP_COLOR,clrRed);
   ObjectSetInteger(0,"topLine",OBJPROP_WIDTH,3);
   ObjectSetInteger(0,"topLine",OBJPROP_RAY_RIGHT,true);
   low1=getmove(MODE_LOW,checkBars,0);
   low2=getmove(MODE_LOW,checkBars,low1+1);
   lowVal1=NormalizeDouble(iLow(_Symbol,_Period,low1),5);
   lowVal2=NormalizeDouble(iLow(_Symbol,_Period,low2),5);
   ObjectDelete(0,"bottomLine");
   ObjectCreate(0,"bottomLine",OBJ_TREND,0,iTime(Symbol(),Period(),low2),iLow(Symbol(),Period(),low2),iTime(Symbol(),Period(),low1),iLow(Symbol(),Period(),low1));
   ObjectSetInteger(0,"bottomLine",OBJPROP_COLOR,clrGreen);
   ObjectSetInteger(0,"bottomLine",OBJPROP_WIDTH,3);
   ObjectSetInteger(0,"bottomLine",OBJPROP_RAY_RIGHT,true);
   if(lowVal1>lowVal2&&highVal1>highVal2)
     {
      Comment("Uptrend",
              "\nCurrent High ",highVal1,"\nPrevious High ",highVal2,
              "\nCurrent Low ",lowVal1,"\nPrevious Low ",lowVal2);
     }
   else
      if(highVal1<highVal2&&lowVal1<lowVal2)
        {
         Comment("Downtrend",
              "\nCurrent High ",highVal1,"\nPrevious High ",highVal2,
              "\nCurrent Low ",lowVal1,"\nPrevious Low ",lowVal2);
        }
      else
        {
         Comment("Sideways",
              "\nCurrent High ",highVal1,"\nPrevious High ",highVal2,
              "\nCurrent Low ",lowVal1,"\nPrevious Low ",lowVal2);
        }
  }
int getmove(int move, int count, int startPos)
  {
   if(move!=MODE_HIGH && move!=MODE_LOW)
      return (-1);
   int currentBar=startPos;
   int moveReturned=getNextMove(move,count*2+1,currentBar-count);
   while(moveReturned!=currentBar)
     {
      currentBar=getNextMove(move,count,currentBar+1);
      moveReturned=getNextMove(move,count*2+1,currentBar-count);
     }
   return(currentBar);
  }
int getNextMove(int move, int count, int startPos)
  {
   if(startPos<0)
     {
      count +=startPos;
      startPos =0;
     }
   return((move==MODE_HIGH)?
          iHighest(Symbol(),Period(),(ENUM_SERIESMODE)move,count,startPos):
          iLowest(Symbol(),Period(),(ENUM_SERIESMODE)move,count,startPos));
  }
The following are differences in this code to detect trends.
Creating four integer variables for two highs and two lows and another four double variables for two highs values and two lows values inside the scope of the OnTick function:
   int high1, high2, low1, low2;
   double highVal1, highVal2, lowVal1, lowVal2;
Updating the two highs values (highVal1, highVal2) by using the NormalizeDouble function to round the value result of highs and its parameters are:
- value: the number that we need to normalize, we will use the iHigh function to return the high price and its parameters are the symbol that will be (_Symbol) for the current one, timeframe that will be (_Period) for the current timeframe, and shift for the index that will be high1 and high2.
- digits: the number of digits after the decimal point, will be 5.
   highVal1=NormalizeDouble(iHigh(_Symbol,_Period,high1),5);
   highVal2=NormalizeDouble(iHigh(_Symbol,_Period,high2),5);
Updating the two lows values (lowVal1, lowVal2) by using the NormalizeDouble function with the same parameters that we mentioned before with the following differences:
- value: use the iLow function to return the low price and its parameters are the same except the shift for the index that will be low1 and low.
   lowVal1=NormalizeDouble(iLow(_Symbol,_Period,low1),5);
   lowVal2=NormalizeDouble(iLow(_Symbol,_Period,low2),5);
Conditions that we need to set to identify trends and we will use the if statement, we need to let the EA check four values of highs and lows continuously then decide their positions related to each other then decide if we have a trend (up or down) of we have no trend (Sideways).
Condition of the uptrend:
If lowVal1 is greater than lowVal2 and at the same time highVal1 is greater than highVal2, we have an uptrend and we need the EA to return a comment on the chart with the following:
- Uptrend
- Current High
- Previous High
- Current Low
- Previous Low
   if(lowVal1>lowVal2&&highVal1>highVal2)
     {
      Comment("Uptrend",
              "\nCurrent High ",highVal1,"\nPrevious High ",highVal2,
              "\nCurrent Low ",lowVal1,"\nPrevious Low ",lowVal2);
     }
Condition of the downtrend:
If highVal1 is lower than highVal2 and at the same time lowVal1 is lower than lowVal2, we have a downtrend and we need the EA to return a comment on the chart with the following:
- Downtrend
- Current High
- Previous High
- Current Low
- Previous Low
   else
      if(highVal1<highVal2&&lowVal1<lowVal2)
        {
         Comment("Downtrend",
              "\nCurrent High ",highVal1,"\nPrevious High ",highVal2,
              "\nCurrent Low ",lowVal1,"\nPrevious Low ",lowVal2);
        }
Condition of Sideways:
If positions of four values are anything except conditions of uptrend and downtrend, we have a sideways and we need the EA to return the following as a comment on the chart:
      else
        {
         Comment("Sideways",
              "\nCurrent High ",highVal1,"\nPrevious High ",highVal2,
              "\nCurrent Low ",lowVal1,"\nPrevious Low ",lowVal2);
        }
After compiling this code with errors and executing its EA, we can receive signals of trends the same as we need. The following are examples from testing as per the trend type and its condition.
Uptrend:

We can see in the previous figure that we have an uptrend example as we have a higher low and higher high on the price action of this chart. So, we received an uptrend signal as a comment in the top left corner of the chart.
Downtrend:

As we can see clearly in the previous chart we have a downtrend as we have a lower high and lower low as per the price action. So, we got a downtrend signal as a comment on the chart.
Sideways:

As we can see in the previous example we have a form that differs from uptrend and downtrend and we have a lower high and higher low which is sideways. So, we got a sideways signal as a comment on the chart.
Chart Double Tops detection
After we learned how to detect highs and lows then detect trends based on that with some development in the base code of detecting highs and lows. So, if we think we find that we can develop more in the code to try detecting specific chart or price action patterns that may indicate a potential movement.
In this part, I will provide an example of these chart patterns with little development in the code to understand the main idea and perform more development to detect more significant patterns especially if you merge some useful technical tools in your code. We will see one of the popular chart patterns that can be seen on the chart which is Double Tops in this part of the article.
Double Tops is a chart pattern that we can see on the chart and consist of semi-same highs which indicates that there is a weakness in the buying power and there is a potential that prices move down there are many details to be significant but if we mention only its form we will that it is the same what we mentioned. The following graph is a visual example of a potential Double Tops pattern:

If you noticed that we mentioned in the previous example that this is a potential pattern and it will be a conformed pattern when prices break and close below the low between the two highs the same as the following graph:

Now, we need to create an MQL5 EA that can be used to detect these two figures in the MetaTrader 5. We need the EA to check the two highs and the two lows continuously and determine their positions related to each other and then return a specific result based on a specific condition which is the condition of the Double Top pattern. Here, we will try to describe a practical pattern in a simple as it can come with a slightly lower or higher high not only the same high, So if the current high is lower than or equal to the previous one and at the same time the current low is greater than the previous one, this will be a signal of potential Double Top. If the current high is lower than or equal to the previous one and at the same time the current low is lower than the previous one, this will be a signal of Double Top.
The following is for the full code to do that:
//+------------------------------------------------------------------+
//|                                             DT patternFinder.mq5 |
//|                                  Copyright 2023, MetaQuotes Ltd. |
//|                                             https://www.mql5.com |
//+------------------------------------------------------------------+
#property copyright "Copyright 2023, MetaQuotes Ltd."
#property link      "https://www.mql5.com"
#property version   "1.00"
//+------------------------------------------------------------------+
void OnTick()
  {
   int checkBars= 5;
   int high1, high2, low1, low2;
   double highVal1, highVal2, lowVal1, lowVal2;
   high1=getmove(MODE_HIGH,checkBars,0);
   high2=getmove(MODE_HIGH,checkBars,high1+1);
   highVal1=NormalizeDouble(iHigh(_Symbol,_Period,high1),5);
   highVal2=NormalizeDouble(iHigh(_Symbol,_Period,high2),5);
   ObjectDelete(0,"topLine");
   ObjectCreate(0,"topLine",OBJ_TREND,0,iTime(Symbol(),Period(),high2),iHigh(Symbol(),Period(),high2),iTime(Symbol(),Period(),high1),iHigh(Symbol(),Period(),high1));
   ObjectSetInteger(0,"topLine",OBJPROP_COLOR,clrRed);
   ObjectSetInteger(0,"topLine",OBJPROP_WIDTH,3);
   ObjectSetInteger(0,"topLine",OBJPROP_RAY_RIGHT,true);
   low1=getmove(MODE_LOW,checkBars,0);
   low2=getmove(MODE_LOW,checkBars,low1+1);
   lowVal1=NormalizeDouble(iLow(_Symbol,_Period,low1),5);
   lowVal2=NormalizeDouble(iLow(_Symbol,_Period,low2),5);
   ObjectDelete(0,"bottomLine");
   ObjectCreate(0,"bottomLine",OBJ_TREND,0,iTime(Symbol(),Period(),low2),iLow(Symbol(),Period(),low2),iTime(Symbol(),Period(),low1),iLow(Symbol(),Period(),low1));
   ObjectSetInteger(0,"bottomLine",OBJPROP_COLOR,clrGreen);
   ObjectSetInteger(0,"bottomLine",OBJPROP_WIDTH,3);
   ObjectSetInteger(0,"bottomLine",OBJPROP_RAY_RIGHT,true);
   if(highVal1<=highVal2&&lowVal1>lowVal2)
     {
      Comment("Potential Double Top",
              "\nCurrent High ",highVal1,"\nPrevious High ",highVal2,
              "\nCurrent Low ",lowVal1,"\nPrevious Low ",lowVal2);
     }

   else
      if(highVal1<=highVal2&&lowVal1<lowVal2)
        {
         Comment("Double Top",
                 "\nCurrent High ",highVal1,"\nPrevious High ",highVal2,
                 "\nCurrent Low ",lowVal1,"\nPrevious Low ",lowVal2);
        }
      else
         Comment(" ");
  }
int getmove(int move, int count, int startPos)
  {
   if(move!=MODE_HIGH && move!=MODE_LOW)
      return (-1);
   int currentBar=startPos;
   int moveReturned=getNextMove(move,count*2+1,currentBar-count);
   while(moveReturned!=currentBar)
     {
      currentBar=getNextMove(move,count,currentBar+1);
      moveReturned=getNextMove(move,count*2+1,currentBar-count);
     }
   return(currentBar);
  }
int getNextMove(int move, int count, int startPos)
  {
   if(startPos<0)
     {
      count +=startPos;
      startPos =0;
     }
   return((move==MODE_HIGH)?
          iHighest(Symbol(),Period(),(ENUM_SERIESMODE)move,count,startPos):
          iLowest(Symbol(),Period(),(ENUM_SERIESMODE)move,count,startPos));
  }
Differences in this code are conditions of the pattern.
In the case of Potential Double Top, if the highVal1 is lower than or equal to highVal2 and lowVal1 is greater than lowVal2 then we need to get a signal as a comment on the chart with the following values:
- Potential Double Top
- Current High
- Previous High
- Current Low
- Previous Low
   if(highVal1<=highVal2&&lowVal1>lowVal2)
     {
      Comment("Potential Double Top",
              "\nCurrent High ",highVal1,"\nPrevious High ",highVal2,
              "\nCurrent Low ",lowVal1,"\nPrevious Low ",lowVal2);
     }
In the case of Double Top, if the highVal1 is lower than or equal to highVal2 and lowVal1 is lower than lowVal2 then we need to get a signal as a comment on the chart with the following values:
- Double Top
- Current High
- Previous High
- Current Low
- Previous Low
   else
      if(highVal1<=highVal2&&lowVal1<lowVal2)
        {
         Comment("Double Top",
                 "\nCurrent High ",highVal1,"\nPrevious High ",highVal2,
                 "\nCurrent Low ",lowVal1,"\nPrevious Low ",lowVal2);
        }
In the case of no potential or double top pattern, return nothing as a comment
      else
         Comment(" ");
After compiling this code without errors and executing its EA, we can find the following example from testing as signals.
In the case of Potential Double Top:

As we can in the previous chart we have a potential double top signal as there is matching with preset conditions, which are higher low and equivalent high.
In the case of Double Top:

As we can in the previous chart we have a double top signal as there is a matching with preset conditions, that is a lower or equivalent high and lower low.
Chart Double Bottoms detection
In this part, we will learn how to detect the opposite pattern of the double top which is the double bottom pattern. Double Bottoms is a chart pattern that we can see on the chart and consist of semi-same lows which indicates that there is a weakness in the selling power and there is a potential that prices move up there are many details also to be significant but if we mention only its form we will find that it is the same what we mentioned. The following graph is a visual example of a potential Double Bottoms pattern:


We need to create another MQL5 EA that can be used to detect the previous two figures in the MetaTrader 5. We need the EA to check the two lows and the two highs continuously and determine their positions related to each other and then return a specific result based on the condition of the Double Bottom pattern. The same simple development in the code will be applied with the opposite case to approach a practical pattern with a slightly higher or lower low not only the same high, So if the current low is higher than or equal to the previous one and at the same time the current high is lower than the previous one, but this will be a signal of potential Double Bottom. If the current low is greater than or equal to the previous one and at the same time the current high is higher than the previous one, this will be a signal of Double Bottom.
The following is for the full code to do that:
//+------------------------------------------------------------------+
//|                                             DB patternFinder.mq5 |
//|                                  Copyright 2023, MetaQuotes Ltd. |
//|                                             https://www.mql5.com |
//+------------------------------------------------------------------+
#property copyright "Copyright 2023, MetaQuotes Ltd."
#property link      "https://www.mql5.com"
#property version   "1.00"
//+------------------------------------------------------------------+
void OnTick()
  {
   int checkBars= 5;
   int high1, high2, low1, low2;
   double highVal1, highVal2, lowVal1, lowVal2;
   high1=getmove(MODE_HIGH,checkBars,0);
   high2=getmove(MODE_HIGH,checkBars,high1+1);
   highVal1=NormalizeDouble(iHigh(_Symbol,_Period,high1),5);
   highVal2=NormalizeDouble(iHigh(_Symbol,_Period,high2),5);
   ObjectDelete(0,"topLine");
   ObjectCreate(0,"topLine",OBJ_TREND,0,iTime(Symbol(),Period(),high2),iHigh(Symbol(),Period(),high2),iTime(Symbol(),Period(),high1),iHigh(Symbol(),Period(),high1));
   ObjectSetInteger(0,"topLine",OBJPROP_COLOR,clrRed);
   ObjectSetInteger(0,"topLine",OBJPROP_WIDTH,3);
   ObjectSetInteger(0,"topLine",OBJPROP_RAY_RIGHT,true);
   low1=getmove(MODE_LOW,checkBars,0);
   low2=getmove(MODE_LOW,checkBars,low1+1);
   lowVal1=NormalizeDouble(iLow(_Symbol,_Period,low1),5);
   lowVal2=NormalizeDouble(iLow(_Symbol,_Period,low2),5);
   ObjectDelete(0,"bottomLine");
   ObjectCreate(0,"bottomLine",OBJ_TREND,0,iTime(Symbol(),Period(),low2),iLow(Symbol(),Period(),low2),iTime(Symbol(),Period(),low1),iLow(Symbol(),Period(),low1));
   ObjectSetInteger(0,"bottomLine",OBJPROP_COLOR,clrGreen);
   ObjectSetInteger(0,"bottomLine",OBJPROP_WIDTH,3);
   ObjectSetInteger(0,"bottomLine",OBJPROP_RAY_RIGHT,true);
   if(lowVal1>=lowVal2&&highVal1<highVal2)
     {
      Comment("Potential Double Bottom",
              "\nCurrent High ",highVal1,"\nPrevious High ",highVal2,
              "\nCurrent Low ",lowVal1,"\nPrevious Low ",lowVal2);
     }
   else
      if(lowVal1>=lowVal2&&highVal1>highVal2)
        {
         Comment("Double Bottom",
                 "\nCurrent High ",highVal1,"\nPrevious High ",highVal2,
                 "\nCurrent Low ",lowVal1,"\nPrevious Low ",lowVal2);
        }
      else
         Comment(" ");
  }
int getmove(int move, int count, int startPos)
  {
   if(move!=MODE_HIGH && move!=MODE_LOW)
      return (-1);
   int currentBar=startPos;
   int moveReturned=getNextMove(move,count*2+1,currentBar-count);
   while(moveReturned!=currentBar)
     {
      currentBar=getNextMove(move,count,currentBar+1);
      moveReturned=getNextMove(move,count*2+1,currentBar-count);
     }
   return(currentBar);
  }
int getNextMove(int move, int count, int startPos)
  {
   if(startPos<0)
     {
      count +=startPos;
      startPos =0;
     }
   return((move==MODE_HIGH)?
          iHighest(Symbol(),Period(),(ENUM_SERIESMODE)move,count,startPos):
          iLowest(Symbol(),Period(),(ENUM_SERIESMODE)move,count,startPos));
  }
Differences in this code are conditions of the pattern.
In the case of the Potential Double Bottom, if the lowVal1 is greater than or equal to the lowVal2 and the highVal1 is lower than the highVal2 then we need to get a signal as a comment on the chart with the following values:
- Potential Double Bottom
- Current High
- Previous High
- Current Low
- Previous Low
   if(lowVal1>=lowVal2&&highVal1<highVal2)
     {
      Comment("Potential Double Bottom",
              "\nCurrent High ",highVal1,"\nPrevious High ",highVal2,
              "\nCurrent Low ",lowVal1,"\nPrevious Low ",lowVal2);
     }
In the case of Double Top, if lowVal1 is greater than or equal to the lowVal2 and the highVal1 is greater than the highVal2 then we need to get a signal as a comment on the chart with the following values:
- Double Bottom
- Current High
- Previous High
- Current Low
- Previous Low
   else
      if(lowVal1>=lowVal2&&highVal1>highVal2)
        {
         Comment("Double Bottom",
                 "\nCurrent High ",highVal1,"\nPrevious High ",highVal2,
                 "\nCurrent Low ",lowVal1,"\nPrevious Low ",lowVal2);
        }
After compiling this code without errors and executing its EA, we can get the following signals as examples from testing.
In the case of the Potential Double Bottom:

As we can in the previous chart we have a potential double bottom signal as there is a matching with preset conditions, that there are lower high and equivalent or higher low.
In the case of the Double Bottom:

As we can in the previous chart we have a double bottom signal as there is a matching with preset conditions that there are a higher high and equivalent or higher low.
Conclusion
Price action is the most important thing for traders as they trade based on understanding this price action and if they understand it very well they can take better investment or trading decisions. Price action forms a lot of patterns that we need to read and understand also. We tried in this article to provide what may make this task easier by creating systems by MQL5 to be used in the MetaTrader 5 trading terminal.
We learned how to detect trends (uptrend, downtrend, and sideways) and one of the popular chart patterns which are double top and its opposite double bottom after learning how to detect highs and lows. We also provided a good base for every concept of trends and this chart type to be able to develop this mentioned programs or systems based on your suitable conditions. Also, after learning the main concept to create a system that can detect highs and lows you can develop this system more and more to be able to detect more chart patterns like head and shoulders, triangles, rectangles...etc. I hope that you find this article useful for you to develop your trading and trading system accordingly to get better results from your trading business.
- Free trading apps
- Over 8,000 signals for copying
- Economic news for exploring financial markets
You agree to website policy and terms of use
Un grand merci pour cet article, car c'est vraiment déjà un bon début pour moi. D'autant plus que je ne peux pas m'arrêter à longueur de journée à parcourir les articles postés ici sur ce magnifique site à la recherche de ceux qui pourraient justement utiliser cette possibilité de faire la détection automatique de ce genre de chiffres, qui, d'après le propre homme peu expérimenté dans cette entreprise, sont d'une importance significative dans l'analyse technique.
Seulement, par rapport à votre code, en ce qui concerne la détection des configurations en M (double top) et celles en W ( double bottom ), n'y at-il aucune possibilité de proposer un code qui soit capable de tracer plutôt 4 lignes différentes et définitives (dessin plus ou moins clairement sur le graphique an M) ? Plutôt que des lignes qui se redessinent à mesure que les prix changent, ce qui n'est pas du tout une bonne chose a choisi lorsqu'il s'agit de repérer des modèles.
Quant au double top, par exemple :
1. Une première ligne, qui dessinera la première jambe haussière. Et la ligne reste définitive sans plus avancer avec les prochains changements de cap...
2. Une seconde, qui tracera la première correction baissière, indiquera dans le même temps une formation potentielle d'un premier sommet d'une figure M potentielle.
3. Un troisième, qui retrace la reprise haussière (une seconde impulsion haussière), et alerte le trader sur l'imminence d'un retour…
4. Et, enfin, une ligne arrière qui sera tracée une fois la figure réellement formée...
Eh bien, je pense que vous avez compris mon inquiétude.
Est-ce un code capable de faire ces différents tracés n'est-ce pas possible ? MERCI
Please post in English only on this forum.
You can use automatic translation tool if needed.
Thanks.A big thank you for this article, because it is really a non beginning already for me. Especially since I can't stop all day long to browse the articles posted here on this magnificent site in search of those who could precisely use this possibility to make automatic detection of this kind of figures, which, according to the own man little experience in this business, are of significant importance in technical analysis.
Only, compared to your code, with regard to the detection of configurations in M (double top) and those in W ( double bottom ), is there no possibility of proposing a code which is able to rather draw 4 different and definitive lines (drawing more or less clearly on the graph an M)? Rather than lines that redraw as prices change, which is not a good thing at all when it comes to spotting patterns.
As for the double top, for example:
1. A first line, which will draw the first bullish leg. And the line remains final without moving any further with the next course changes...
2. A second, which will trace the first bearish correction, will at the same time indicate a potential formation of a first top of a potential M pattern.
3. A third, which traces the bullish recovery (a second bullish impulse), and alerts the trader to the imminence of a return…
4. And, finally, a behind line that will be drawn once the figure is really formed...
Well, I think you have understood my concern.
Is it a code capable of doing these different tracings is it not possible? THANKS
Thanks for your comment.
I know that detecting patterns may be difficult based on the pattern form as there are many accepted variances and you may find that you need to develop your code as per objectives and what you mentioned.
What I think is that anything you can describe in a logical way, you can code it.
Thanks
Ok. Thanks
Translated to English by moderator.
This is the English forum. Please only write in English.
Best regards.