Data Science and Machine Learning (Part 08): K-Means Clustering in plain MQL5

Data is like garbage. You'd better know what you are going to do with it before you collect it.
Mark Twain
Unsupervised Learning
Is a Machine learning paradigm for problems where the available data consists of unlabeled examples. Unlike supervised learning techniques such as regression methods, SVM, decision trees, neural networks, and many others discussed in this article series, where we always have labeled datasets that we fit our models upon. In unsupervised learning, the data is unlabeled so, it's up to the algorithm to figure out the relationship and everything else on itself.
Examples of unsupervised learning tasks are clustering, dimension reduction, and density estimation.
Clustering Analysis
Clustering analysis is a task of grouping a set of objects in such a way that objects with the same attributes are placed within the same groups (clusters).
If you go to the mall, you will find similar items kept together right? Someone did the process of grouping them. When the dataset isn't grouped the clustering analysis will do just like that, group the data values that are more similar(in some sense) to each other than the rest of the groups (clusters).
Clustering analysis itself is not a specific algorithm. The general task can be solved through various algorithms that differ significantly in terms of their understanding of what constitutes a cluster.
Img src: wikipedia
There are three types of clustering widely known:- Exclusive clustering
- Overlapping clustering
- Hierachial clustering
Exclusive clustering
This is hard clustering in which data points/ items belong exclusively to one another, for example, k-means clustering.
Overlapping Clustering
Is a type of clustering in which the data points/items belongs to multiple clusters. For example Fuzzy/c-means algorithm.
Hierachial Clustering
This type of clustering seeks to build a hierarchy of clusters.
Where are clustering algorithms used?
Clustering techniques are used by Amazon and many e-commerce sites to recommend similar items that were previously brought together. Netflix does the same thing by recommending the movies that were watched together based on interests.
Basically, they are used to identify groups of similar objects or interests in a multivariate dataset collected from fields such as marketing, biomedical, and geo-spatial.
K-Means Clustering
Not to be confused with the k-nearest neighbors, will be covered in the next article.
The k-means algorithm is a method of vector quantization, that aims to partition n observations into k clusters in which each observation belongs to the cluster with the nearest mean/ nearest centroid where k < n. This is the most widely known and most used clustering algorithm.The math behind the algorithm is simple below is the image of the processes involved in the algorithm. 
Now, to understand how this process works, let's do the operations manually and by hand while we automate the process by coding it in the Meta editor. Let's create a matrix to store the centroids for our sample dataset in the private section of the CKMeans library.
class CKMeans
  {
   private:
                        ulong  n;
                        uint   m_clusters;
                        ulong  m_cols;
                        matrix InitialCentroids; //Intitial Centroids matrix
                        vector cluster_assign;
 }
As always let's use a simple dataset for the sake of building the library, we will then see how we can use the algorithm in a real-life dataset situation.
    matrix DMatrix = { {2,10},
                       {2,5},
                       {8,4},
                       {5,8},
                       {7,5},
                       {6,4},
                       {1,2},
                       {4,9}
                     };
01: Starting the Algorithm & 02: Calculating the Centroids
To start the algorithm we need to have the initial centers for each of the cluster we will be looking for, so let's choose random centroids store them in an InitialCentroid Matrix.
      m_cols = Matrix.Cols();
      n = Matrix.Rows(); //number of elements | Matrix Rows

      InitialCentroids.Resize(m_clusters,m_cols);
      vector cluster_comb_v = {};
      matrix cluster_comb_m = {};
      vector rand_v = {};

      for (ulong i=0; i<m_clusters; i++)
        {
          rand_v = Matrix.Row(i * m_clusters);
          InitialCentroids.Row(rand_v,i);
        }
     Print("Initial Centroids matrix\n",InitialCentroids);
Here are the Initial Centroids:
CS      0       06:44:02.152    K-means test (EURUSD,M1)        Initial Centroids matrix
CS      0       06:44:02.152    K-means test (EURUSD,M1)        [[2,10]
CS      0       06:44:02.152    K-means test (EURUSD,M1)         [5,8]
CS      0       06:44:02.152    K-means test (EURUSD,M1)         [1,2]]
We are done with the Initial yet very crucial step. The next step according to the image is calculating the centroids, wait for a second, didn't we just calculate the centroid above? That's right we do not need to calculate the centroid the first time as we have the initial centroids, the centroids will be updated at the end.
03: Grouping based on Minimum Distance
Now we look at the distance between each and every point in the dataset from the obtained centroids. A data point nearest to a specific centroid than all the centroids will be assigned to that cluster.
To find the distance there are two mathematical formulas we can use: the Euclidean Distance or the Rectilinear Distance.
Euclidean Distance
This is a method of measuring the distance between the two points based on the Pythagoras Theorem. It's formula is given below:

Rectilinear Distance
The rectilinear distance is simply the sum of the difference in x and y coordinates between two points. It's formula is given below:

Due to simplicity, I prefer using the Rectilinear method to find the distance between the centroids and the points. Let's plot the matrix in Excel.

To achieve the same results in MetaEditor we are going to have to create a 8 rows x 3 clusters matrix for storing these Rectilinear distances that we are going to use to assign for the clusters. Why three clusters? I chose three clusters while initializing the library, you can choose any initial number of cluster based on what you want to achieve, we will see this in details later on. Below is the library constructor.
CKMeans::CKMeans(int clusters=3)
 {
    m_clusters = clusters;
 }
Below is how we create a matrix to store the rectilinear distances:
     matrix rect_distance = {};  //matrix to store rectilinear distances
     rect_distance.Reshape(n,m_clusters);
Now, let's calculate the Rectilinear distances and store the results in the rect_distance matrix we just created:
     vector v_matrix = {}, v_centroid = {};
     double output = 0;

     for (ulong i=0; i<rect_distance.Rows(); i++)
       for (ulong j=0; j<rect_distance.Cols(); j++)
          {
             v_matrix = Matrix.Row(i);
	     v_centroid = InitialCentroids.Row(j);
              ZeroMemory(output);
               for (ulong k=0; k<v_matrix.Size(); k++)
                    output += MathAbs(v_matrix[k] - v_centroid[k]); //Rectilinear distance
               rect_distance[i][j] = output;
          }
     Print("Rectilinear distance matrix\n",rect_distance);
Output:
CS      0       15:17:52.136    K-means test (EURUSD,M1)        Rectilinear distance matrix
CS      0       15:17:52.136    K-means test (EURUSD,M1)        [[0,5,9]
CS      0       15:17:52.136    K-means test (EURUSD,M1)         [5,6,4]
CS      0       15:17:52.136    K-means test (EURUSD,M1)         [12,7,9]
CS      0       15:17:52.136    K-means test (EURUSD,M1)         [5,0,10]
CS      0       15:17:52.136    K-means test (EURUSD,M1)         [10,5,9]
CS      0       15:17:52.136    K-means test (EURUSD,M1)         [10,5,7]
CS      0       15:17:52.136    K-means test (EURUSD,M1)         [9,10,0]
CS      0       15:17:52.136    K-means test (EURUSD,M1)         [3,2,10]]
As said earlier, the way the K-means clustering groups data point is that a data point with the smallest distance from a specific cluster belongs to that cluster. Now from the rect_distance matrix each column represents a cluster so, we look at the minimum value in a row, a column with the minimum number of all gets assigned to that cluster, see the image below.

Code for assigning the clusters;
//---  Assigning the Clusters

    matrix cluster_cent = {}; //cluster centroids
    ulong cluster = 0;
     for (ulong i=0; i<rect_distance.Rows(); i++)
       {
          v_row = rect_distance.Row(i);
          cluster = v_row.ArgMin();
          cluster_assign[i] = (uint)cluster;
       }
    Print("Assigned clusters\n",cluster_assign);
Output:
CS      0       15:17:52.136    K-means test (EURUSD,M1)        Assigned clusters
CS      0       15:17:52.136    K-means test (EURUSD,M1)        [0,2,1,1,1,1,2,1]
Now that we have assigned the points to their respective clusters, it's time we group the data points based on the newly found clusters. If we perform the process in excel the clusters will be as shown below on the image:

As simple as the process of manually grouping the data points was, it is not that simple when we try to code for it because the clusters will always have different sizes. So, if we try to use the matrix to store the clusters, there will be a difference in the number of rows for the columns. The array method is inconvenient and hard to read, if we try to use the CSV file to store the values the process will fall-flat because we are supposed to dynamically write the columns for each of the clusters.
I came up with an Idea to use the 3 x n clusters_matrix to store the clusters. This is a matrix of zero values that were initially resized in such a way that the number of rows is equal to the number of clusters and the number of columns is set to be the largest number the cluster can be.
In the end, each cluster is stored horizontally in the row of the matrix.
Below is the output:
CS      0       15:17:52.136    K-means test (EURUSD,M1)        clustered Matrix
CS      0       15:17:52.136    K-means test (EURUSD,M1)        [[2,10,0,0,0,0,0,0,0,0,0,0,0,0,0,0,0,0,0,0,0,0,0,0]
CS      0       15:17:52.136    K-means test (EURUSD,M1)         [2,5,1,2,0,0,0,0,0,0,0,0,0,0,0,0,0,0,0,0,0,0,0,0]
CS      0       15:17:52.136    K-means test (EURUSD,M1)         [8,4,5,8,7,5,6,4,4,9,0,0,0,0,0,0,0,0,0,0,0,0,0,0]]
Since this matrix is passed as a reference in the KMeansClustering function where all these operations get done, it can be extracted and you can filter the values in such a way that you ignore the zero values after the last non-negative zero value.
void CKMeans::KMeansClustering(const matrix &Matrix, matrix &clustered_matrix)
04: Updating the Centroids
The new centroids for each cluster are obtained by finding the mean of all the individual elements in the cluster. Here is the code for it:
            vector x_y_z = {0,0};
            ZeroMemory(rand_v);

            for (ulong k=0; k<cluster_cent.Cols(); k++)
               {
                  x_y_z.Resize(cluster_cent.Cols());
                  rand_v = cluster_cent.Col(k);
                  x_y_z[k] = rand_v.Mean();
               }

            InitialCentroids.Row(x_y_z, i);

            if (index >= n_each_cluster.Size()) break;
       }
       Print("New Centroids\n",InitialCentroids,"\nclustered Matrix\n",clustered_matrix);
Below is the output:
CS      0       15:17:52.136    K-means test (EURUSD,M1)        New Centroids
CS      0       15:17:52.136    K-means test (EURUSD,M1)        [[2,10]
CS      0       15:17:52.136    K-means test (EURUSD,M1)         [1.5,3.5]
CS      0       15:17:52.136    K-means test (EURUSD,M1)         [6,6]]
Now that we have seen how the entire process works, we have to repeat from the second step to the last one until the data is well put into the respective clusters. This can be achieved in two ways, some folks put the logic in such a way that whenever the new centroids for the clusters stop changing, then the optimal values for all the clusters are already found, while some put the limited number of iterations for this algorithm. I think the problem with the first way is that it requires us to put an infinite loop that will be controlled by the if statement to pull the break statement. I think it is a smart thing to limit the algorithm to the number of iterations.
Below is the complete k-means clustering algorithm function with Iterations added:
void CKMeans::KMeansClustering(const matrix &Matrix, matrix &clustered_matrix,int iterations = 10)
 {
      m_cols = Matrix.Cols();
      n = Matrix.Rows(); //number of elements | Matrix Rows

      InitialCentroids.Resize(m_clusters,m_cols);
      cluster_assign.Resize(n);

      clustered_matrix.Resize(m_clusters, m_clusters*n);
      clustered_matrix.Fill(NULL);

      vector cluster_comb_v = {};
      matrix cluster_comb_m = {};
      vector rand_v = {};
      for (ulong i=0; i<m_clusters; i++)
        {
          rand_v = Matrix.Row(i * m_clusters);
          InitialCentroids.Row(rand_v,i);
        }
     Print("Initial Centroids matrix\n",InitialCentroids);
//---

    vector v_row;
    vector n_each_cluster; //Each cluster content

     matrix rect_distance = {};  //matrix to store rectilinear distances
     rect_distance.Reshape(n,m_clusters);

     vector v_matrix = {}, v_centroid = {};
     double output = 0;

//---
 for (int iter=0; iter<iterations; iter++)
   {
     printf("\n<<<<< %d >>>>>\n",iter );

     for (ulong i=0; i<rect_distance.Rows(); i++)
       for (ulong j=0; j<rect_distance.Cols(); j++)
          {
             v_matrix = Matrix.Row(i);
	     v_centroid = InitialCentroids.Row(j);

              ZeroMemory(output);
               for (ulong k=0; k<v_matrix.Size(); k++)
                    output += MathAbs(v_matrix[k] - v_centroid[k]); //Rectilinear distance

               rect_distance[i][j] = output;
          }

     Print("Rectilinear distance matrix\n",rect_distance);

//---  Assigning the Clusters

    matrix cluster_cent = {}; //cluster centroids
    ulong cluster = 0;
     for (ulong i=0; i<rect_distance.Rows(); i++)
       {
          v_row = rect_distance.Row(i);
          cluster = v_row.ArgMin();

          cluster_assign[i] = (uint)cluster;
       }
    Print("Assigned clusters\n",cluster_assign);
//--- Combining the clusters

      n_each_cluster.Resize(m_clusters);

      for (ulong i=0, index =0, sum_count = 0; i<cluster_assign.Size(); i++)
        {

            for (ulong j=0, count = 0; j<cluster_assign.Size(); j++)
                {
                  //printf("cluster_assign[%d] cluster_assign[%d]",i,j);
                   if (cluster_assign[i] == cluster_assign[j])
                     {
                        count++;
                        n_each_cluster[index] = (uint)count;

                        cluster_comb_m.Resize(count, m_cols);
                        cluster_comb_m.Row(Matrix.Row(j) , count-1);
                        cluster_cent.Resize(count, m_cols);
                        // New centroids
                        cluster_cent.Row(Matrix.Row(j),count-1);
                        sum_count++;
                     }
                   else continue;
                }

//---
           MatrixToVector(cluster_comb_m, cluster_comb_v);
       // solving for new cluster and updtating the old ones

           if (iter == iterations-1)
		 clustered_matrix.Row(cluster_comb_v, index);
//---
           index++;
//---
            vector x_y_z = {0,0};
            ZeroMemory(rand_v);

            for (ulong k=0; k<cluster_cent.Cols(); k++)
               {
                  x_y_z.Resize(cluster_cent.Cols());
                  rand_v = cluster_cent.Col(k);
                  x_y_z[k] = rand_v.Mean();
               }
            InitialCentroids.Row(x_y_z, i);
            if (index >= n_each_cluster.Size())
		 break;
       }
       Print("New Centroids\n",InitialCentroids);//,"\nclustered Matrix\n",clustered_matrix);
    } //end of iterations
 }
//+------------------------------------------------------------------+
After 10 iterations the algorithm logs briefly looks like below:
CS      0       20:40:05.438    K-means test (EURUSD,M1)        <<<<< 0 >>>>>
CS      0       20:40:05.438    K-means test (EURUSD,M1)
CS      0       20:40:05.438    K-means test (EURUSD,M1)        Rectilinear distance matrix
CS      0       20:40:05.438    K-means test (EURUSD,M1)        [[0,5,9]
CS      0       20:40:05.438    K-means test (EURUSD,M1)         [5,6,4]
CS      0       20:40:05.438    K-means test (EURUSD,M1)         [12,7,9]
CS      0       20:40:05.438    K-means test (EURUSD,M1)         [5,0,10]
CS      0       20:40:05.438    K-means test (EURUSD,M1)         [10,5,9]
CS      0       20:40:05.438    K-means test (EURUSD,M1)         [10,5,7]
CS      0       20:40:05.438    K-means test (EURUSD,M1)         [9,10,0]
CS      0       20:40:05.438    K-means test (EURUSD,M1)         [3,2,10]]
CS      0       20:40:05.438    K-means test (EURUSD,M1)        Assigned clusters
CS      0       20:40:05.438    K-means test (EURUSD,M1)        [0,2,1,1,1,1,2,1]
CS      0       20:40:05.438    K-means test (EURUSD,M1)        New Centroids
CS      0       20:40:05.438    K-means test (EURUSD,M1)        [[2,10]
CS      0       20:40:05.438    K-means test (EURUSD,M1)         [1.5,3.5]
CS      0       20:40:05.438    K-means test (EURUSD,M1)         [6,6]]
CS      0       20:40:05.438    K-means test (EURUSD,M1)
CS      0       20:40:05.438    K-means test (EURUSD,M1)        <<<<< 1 >>>>>
CS      0       20:40:05.438    K-means test (EURUSD,M1)
CS      0       20:40:05.438    K-means test (EURUSD,M1)        Rectilinear distance matrix
CS      0       20:40:05.438    K-means test (EURUSD,M1)        [[0,7,8]
CS      0       20:40:05.438    K-means test (EURUSD,M1)         [5,2,5]
CS      0       20:40:05.438    K-means test (EURUSD,M1)         [12,7,4]
CS      0       20:40:05.438    K-means test (EURUSD,M1)         [5,8,3]
CS      0       20:40:05.438    K-means test (EURUSD,M1)         [10,7,2]
CS      0       20:40:05.438    K-means test (EURUSD,M1)         [10,5,2]
CS      0       20:40:05.438    K-means test (EURUSD,M1)         [9,2,9]
CS      0       20:40:05.438    K-means test (EURUSD,M1)         [3,8,5]]
CS      0       20:40:05.438    K-means test (EURUSD,M1)        Assigned clusters
CS      0       20:40:05.438    K-means test (EURUSD,M1)        [0,1,2,2,2,2,1,0]
CS      0       20:40:05.438    K-means test (EURUSD,M1)        New Centroids
CS      0       20:40:05.438    K-means test (EURUSD,M1)        [[3,9.5]
CS      0       20:40:05.438    K-means test (EURUSD,M1)         [1.5,3.5]
CS      0       20:40:05.438    K-means test (EURUSD,M1)         [6.5,5.25]]
CS      0       20:40:05.438    K-means test (EURUSD,M1)
CS      0       20:40:05.438    K-means test (EURUSD,M1)        <<<<< 2 >>>>>
CS      0       20:40:05.438    K-means test (EURUSD,M1)
CS      0       20:40:05.438    K-means test (EURUSD,M1)        Rectilinear distance matrix
CS      0       20:40:05.438    K-means test (EURUSD,M1)        [[1.5,7,9.25]
CS      0       20:40:05.438    K-means test (EURUSD,M1)         [5.5,2,4.75]
CS      0       20:40:05.438    K-means test (EURUSD,M1)         [10.5,7,2.75]
CS      0       20:40:05.438    K-means test (EURUSD,M1)         [3.5,8,4.25]
CS      0       20:40:05.438    K-means test (EURUSD,M1)         [8.5,7,0.75]
CS      0       20:40:05.438    K-means test (EURUSD,M1)         [8.5,5,1.75]
CS      0       20:40:05.438    K-means test (EURUSD,M1)         [9.5,2,8.75]
CS      0       20:40:05.438    K-means test (EURUSD,M1)         [1.5,8,6.25]]
CS      0       20:40:05.438    K-means test (EURUSD,M1)        Assigned clusters
CS      0       20:40:05.438    K-means test (EURUSD,M1)        [0,1,2,0,2,2,1,0]
CS      0       20:40:05.438    K-means test (EURUSD,M1)        New Centroids
CS      0       20:40:05.438    K-means test (EURUSD,M1)        [[3.666666666666667,9]
CS      0       20:40:05.438    K-means test (EURUSD,M1)         [1.5,3.5]
CS      0       20:40:05.438    K-means test (EURUSD,M1)         [7,4.333333333333333]]
CS      0       20:40:05.438    K-means test (EURUSD,M1)
CS      0       20:40:05.438    K-means test (EURUSD,M1)        <<<<< 3 >>>>>
CS      0       20:40:05.438    K-means test (EURUSD,M1)
CS      0       20:40:05.438    K-means test (EURUSD,M1)        Rectilinear distance matrix
CS      0       20:40:05.438    K-means test (EURUSD,M1)        [[2.666666666666667,7,10.66666666666667]
CS      0       20:40:05.438    K-means test (EURUSD,M1)         [5.666666666666666,2,5.666666666666667]
CS      0       20:40:05.438    K-means test (EURUSD,M1)         [9.333333333333334,7,1.333333333333333]
CS      0       20:40:05.438    K-means test (EURUSD,M1)         [2.333333333333333,8,5.666666666666667]
CS      0       20:40:05.438    K-means test (EURUSD,M1)         [7.333333333333334,7,0.666666666666667]
CS      0       20:40:05.438    K-means test (EURUSD,M1)         [7.333333333333334,5,1.333333333333333]
CS      0       20:40:05.438    K-means test (EURUSD,M1)         [9.666666666666666,2,8.333333333333332]
CS      0       20:40:05.438    K-means test (EURUSD,M1)         [0.3333333333333335,8,7.666666666666667]]
CS      0       20:40:05.438    K-means test (EURUSD,M1)        Assigned clusters
CS      0       20:40:05.438    K-means test (EURUSD,M1)        [0,1,2,0,2,2,1,0]
CS      0       20:40:05.438    K-means test (EURUSD,M1)        New Centroids
CS      0       20:40:05.438    K-means test (EURUSD,M1)        [[3.666666666666667,9]
CS      0       20:40:05.438    K-means test (EURUSD,M1)         [1.5,3.5]
CS      0       20:40:05.438    K-means test (EURUSD,M1)         [7,4.333333333333333]]
CS      0       20:40:05.438    K-means test (EURUSD,M1)
.....
.....
.....
.....

CS      0       20:40:05.438    K-means test (EURUSD,M1)
CS      0       20:40:05.438    K-means test (EURUSD,M1)        <<<<< 9 >>>>>
CS      0       20:40:05.438    K-means test (EURUSD,M1)
CS      0       20:40:05.438    K-means test (EURUSD,M1)        Rectilinear distance matrix
CS      0       20:40:05.438    K-means test (EURUSD,M1)        [[2.666666666666667,7,10.66666666666667]
CS      0       20:40:05.438    K-means test (EURUSD,M1)         [5.666666666666666,2,5.666666666666667]
CS      0       20:40:05.438    K-means test (EURUSD,M1)         [9.333333333333334,7,1.333333333333333]
CS      0       20:40:05.438    K-means test (EURUSD,M1)         [2.333333333333333,8,5.666666666666667]
CS      0       20:40:05.438    K-means test (EURUSD,M1)         [7.333333333333334,7,0.666666666666667]
CS      0       20:40:05.438    K-means test (EURUSD,M1)         [7.333333333333334,5,1.333333333333333]
CS      0       20:40:05.438    K-means test (EURUSD,M1)         [9.666666666666666,2,8.333333333333332]
CS      0       20:40:05.438    K-means test (EURUSD,M1)         [0.3333333333333335,8,7.666666666666667]]
CS      0       20:40:05.438    K-means test (EURUSD,M1)        Assigned clusters
CS      0       20:40:05.438    K-means test (EURUSD,M1)        [0,1,2,0,2,2,1,0]
CS      0       20:40:05.438    K-means test (EURUSD,M1)        New Centroids
CS      0       20:40:05.438    K-means test (EURUSD,M1)        [[3.666666666666667,9]
CS      0       20:40:05.438    K-means test (EURUSD,M1)         [1.5,3.5]
CS      0       20:40:05.438    K-means test (EURUSD,M1)         [7,4.333333333333333]]
After 2 iterations the algorithm already converged and provided the optimal values for the centroids. This brings us to the point of how many iterations are the best for this kind of algorithm. Unlike the gradient descent and other algorithm the k-means clustering doesn't need a lot of iterations to reach the optimal values, it often takes 5 to 10 iterations to completely cluster the simple dataset.
Inside K-Means Test script
In the main function of the test script we initialize the library, we call the k-MeansClustering function, we plot the clusters on the same axis, and lastly we delete the object for the library. void OnStart() { //--- matrix DMatrix = { {2,10}, {2,5}, {8,4}, {5,8}, {7,5}, {6,4}, {1,2}, {4,9} }; int clusters =3; matrix clusterd_mat; clustering = new CKMeans(clusters); clustering.KMeansClustering(DMatrix,clusterd_mat); ObjectsDeleteAll(0,0); ScatterPlotsMatrix("graph",clusterd_mat,"cluster 1"); delete(clustering); }
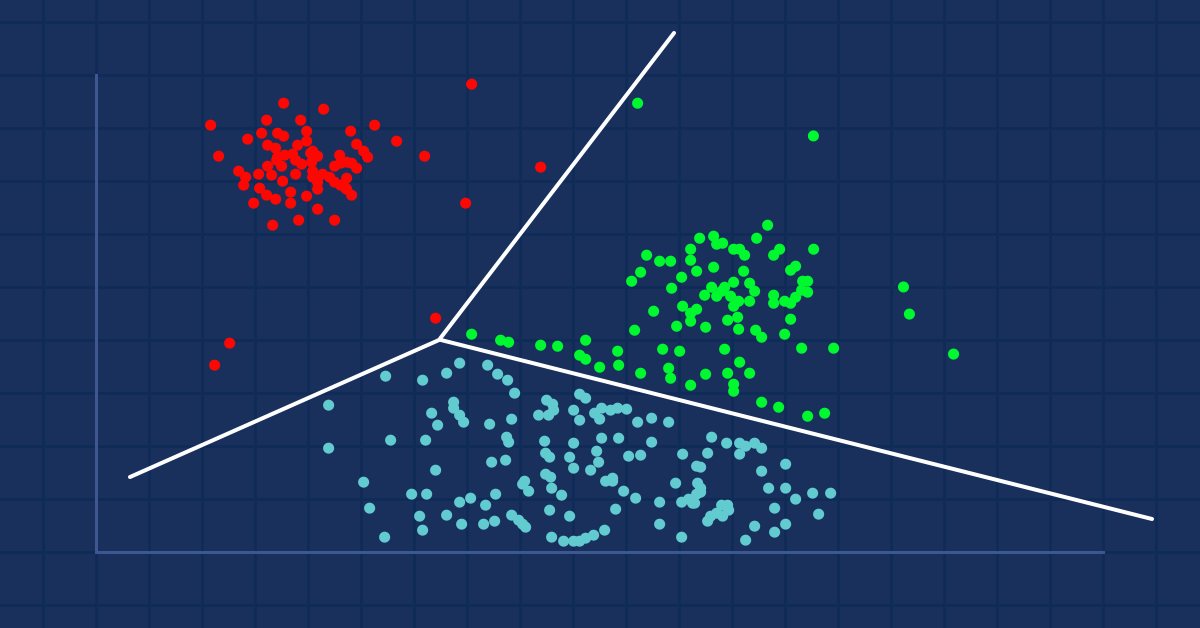
Below is the plot of the clusters:

Great, inside the function ScatterPlotsMatrix() there was called the function to filter the zero values before the values could be plotted on the graph, All the values lying exactly on the x or y axis line on the plot should be ignored.
          vectortoArray(x,x_arr);
          FilterZeros(x_arr);

          graph.CurveAdd(x_arr,CURVE_POINTS," cluster "+string(i+1));
What is the correct number of k clusters?
We now understand how the algorithm works, but we can call the k-means clustering main function and put the number of clusters and that's it. How do we know that the number of the cluster we have selected is the optimal one because this algorithm is affected by initializers, to understand this let's look at something called the Elbow Method.
The Elbow Method
The elbow method is used to find the optimal number of clusters in k-means clustering. The elbow method plots the graph of a cost function that was produced by different values of clusters (k).
As the number of k increases the cost function decreases, this can be identified as overfitting.
When one analyses the elbow graph can see a point where there will be a rapid change in the graph direction and after that, the plot starts to move parallel to the x-axis.

WCSS
The Within Cluster Sum of Squared residuals( WCSS ), is the sum of the squared distance between each point and centroid in the cluster.
Its formula is as given below:

Since the elbow method is an optimization method for the k-means clustering, Each of its iterations requires calling the K-Mean clustering function.
Now to run the elbow method and to be able to obtain the results there are several things we need to change in the main function for k means clustering. The first place we need to change is when obtaining the centroids because when the clusters chosen become equal to the number of rows in the matrix, or anywhere near that then the method for randomly selecting the initial centroid falls short.
      for (ulong i=0; i<m_clusters; i++)
        {
          rand_v = Matrix.Row(i);
          InitialCentroids.Row(rand_v,i);
        }
We also need to change the logic for the largest number of initial clusters to not exceed the number of n samples that are in the dataset, remember from the definition of k-means clustering that k < n.
void CKMeans::ElbowMethod(const int initial_k=1, int total_k=10, bool showPlot = true)
 {
      matrix clustered_mat, _centroids = {};
      if (total_k > (int)n)
	 total_k = (int)n; //>>k should always be less than n
Below is the full code for the Elbow method;
void CKMeans::ElbowMethod(const int initial_k=1, int total_k=10, bool showPlot = true)
 {
      matrix clustered_mat, _centroids = {};

      if (total_k > (int)n)
	 total_k = (int)n; //k should always be less than n

      vector centroid_v={}, x_y_z={};
      vector short_v = {}; //vector for each point
      vector minus_v = {}; //vector to store the minus operation output

      double wcss = 0;
      double WCSS[];  ArrayResize(WCSS,total_k);
      double kArray[]; ArrayResize(kArray,total_k);

      for (int k=initial_k, count_k=0; k<ArraySize(WCSS)+initial_k; k++, count_k++)
        {
         wcss = 0;
         m_clusters = k;
         KMeansClustering(clustered_mat,_centroids,1);

         for (ulong i=0; i<_centroids.Rows(); i++)
            {

               centroid_v = _centroids.Row(i);

               x_y_z = clustered_mat.Row(i);
               FilterZero(x_y_z);
                   for (ulong j=0; j<x_y_z.Size()/m_cols; j++)
                     {
                       VectorCopy(x_y_z,short_v,uint(j*m_cols),(uint)m_cols);

//---                  WCSS ( within cluster sum of squared residuals )
                       minus_v = (short_v - centroid_v);
                       minus_v = MathPow(minus_v,2);
                       wcss += minus_v.Sum();

                     }

            }

          WCSS[count_k] = wcss;
          kArray[count_k] = k;
       }
    Print("WCSS");    ArrayPrint(WCSS);
    Print("kArray");    ArrayPrint(kArray);

//--- Plotting the Elbow on the graph

     if (showPlot)
      {
        ObjectDelete(0,"elbow");
        ScatterCurvePlots("elbow",kArray,WCSS,WCSS,"Elbow line","k","WCSS");
      }
 }
Below is the output of the above block of code:

Looking at the Elbow plot, it is very clear that the optimal number of cluster is found at 3. The values of WCSS has drastically dropped at this point than at every others, from 51.4667 to 14.333.
Okay, so that's it we have everything we need to implement the k-means clustering algorithm in MQL5, so let's see how we can implement the algorithm in the trading environment.
Let's see how we can group the same market price data into several clusters:
   matrix DMatrix = {};
   DMatrix.Resize(bars, 1); //columns determines the dimension of the dataset 1D won't be visualized properly

   vector column_v = {};

   column_v.CopyRates(symbol,PERIOD_CURRENT,COPY_RATES_CLOSE,1,bars);

   DMatrix.Col(column_v,0);
We have just replaced the matrix with the nx1 matrix for the market price values. This time we have used a one dimensional matrix. According to the way we have coded the clustering algorithm one dimensional matrices will not be well visualized and clustered, for example: See the outcome of the entire clustering operation for the NASDAQ symbol for 20 bars on the graphs images below.

The 4 clusters that are best fit according to the elbow method on the graph above the clusters looks much better when plotted on the graph.

Now let's put the values for the same symbol into a 3D matrix and see what happens to the clusters.
   matrix DMatrix = {};
   DMatrix.Resize(bars, 3); //columns determines the dimension of the dataset 1D won't be visualized properly

   vector column_v = {};

   ulong start = 0;
   for (ulong i=0; i<2; i++)
     {
       column_v.CopyRates(symbol,PERIOD_CURRENT,COPY_RATES_CLOSE,start,bars);
       DMatrix.Col(column_v,i);

       start += bars;
     }
Below is how the clusters will look like on the plot:

It appears the three-dimensional matrix when clustered on the same axis provides a lot of outliers in the clusters.
I can think of using a more than one-dimensional matrix when trying to cluster different samples whose values lie on different levels/scales for example. Trying the RSI indicator values and the Moving Average Indicator values, but always plugging these values altogether into a one-dimensional matrix meaning in one column of a matrix is ideal, feel free to explore that and share your with everyone in the discussion section.
One thing I forgot to say before showing the images for the plots, is that I normalized the NASDAQ price values using the Mean-Normalization technique.
MeanNormalization(DMatrix);
This is to make the data well distributed on the plot. Below is the full code.
void MeanNormalization(matrix &mat)
 {

   vector v = {};

    for (ulong i=0; i<mat.Cols(); i++)
       {
          v = mat.Col(i);
          MeanNormalization(v);
          mat.Col(v,i);
       }
 }

//+------------------------------------------------------------------+

void MeanNormalization(vector &v)
 {
   double mean = v.Mean(),
          max = v.Max(),
          min = v.Min();

   for (ulong i=0; i<v.Size(); i++)
      v[i] = (v[i] - mean) / (max - min);

 }
Final thoughts
The k-means clustering is a very useful algorithm that needs to be in the toolbox of every trader and data scientist. One thing to remember is that this algorithm is heavily affected by initializers. If you start the search for the optimal algorithm using the Elbow method by starting at 2 clusters you may reach the optimal number of clusters different than the one who has chosen the initial cluster to be 4. Also the initial centroids do matter a lot that's why I had to add the input in the main clustering function to help one choose whether the initial centroids should be randomly selected or the first three rows of the matrix should be selected instead.void CKMeans::KMeansClustering(matrix &clustered_matrix,matrix ¢roids,int iterations = 1,bool rand_cluster =false)
The function argument rand_cluster for selecting the centroid randomly is set to false by default this is to help when the K-means clustering function is called under the Elbow method function. This is because selecting random centroids while seeking for the optimal clusters doesn't work well. But it does work well when the number of clusters is known.
Best regards.
The mql5 code files used in this article are attached below, there is a slightly change in the code found on the zip files to the code presented above, some lines have been removed for performance purposes while others were just added to make the whole process easy to understand.
GITHUB REPO >> https://github.com/MegaJoctan/Data-Mining-MQL5
 Learn how to design a trading system by Fractals
 Neural networks made easy (Part 24): Improving the tool for Transfer Learning
 DIY technical indicator
- Free trading apps
- Over 8,000 signals for copying
- Economic news for exploring financial markets
You agree to website policy and terms of use
New article Data Science and Machine Learning (Part 08): K-Means Clustering in plain MQL5 has been published:
Author: Omega J Msigwa
hi Omega J Msigwa, thanks your very useful article.
am I missing something or in above code you mean DMatrix?
hi Omega J Msigwa, thanks your very useful article.
am I missing something or in above code you mean DMatrix?
I mean Matrix as explained in the article, since this code is found under the function