ON Trade Hikkake Pattern
- Indicators
- Abdullah Alrai
- Version: 1.0
- Activations: 5
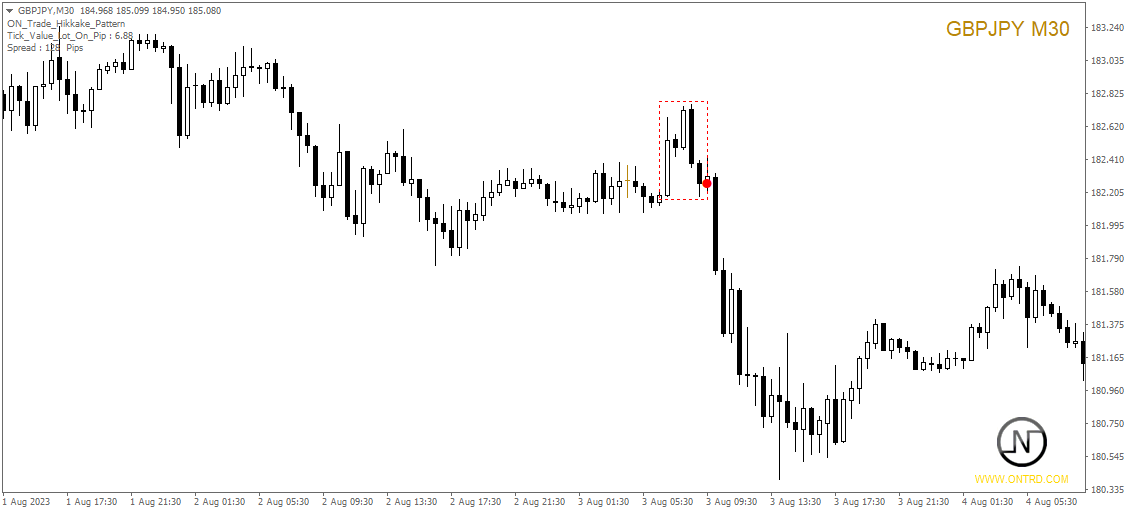
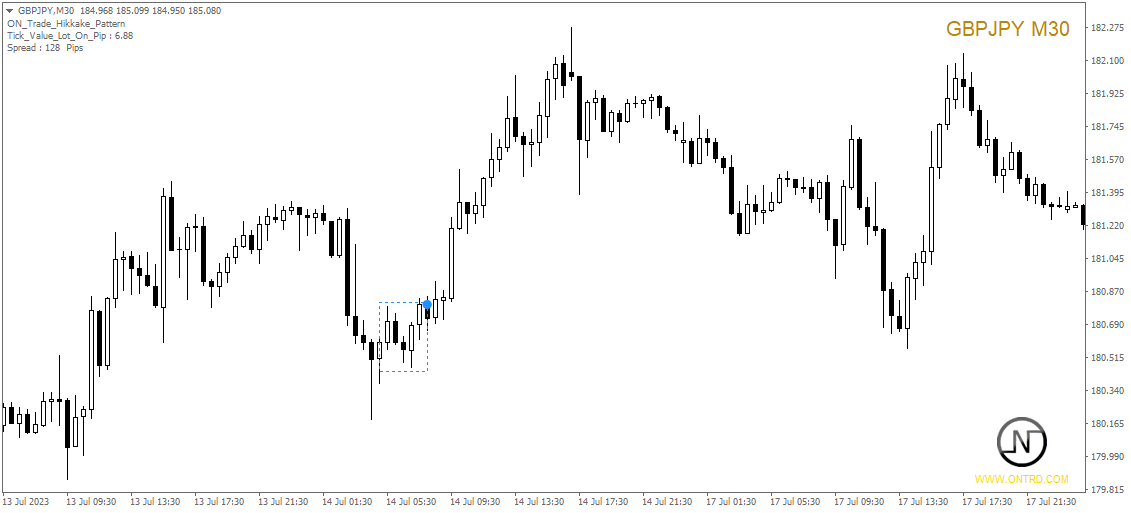
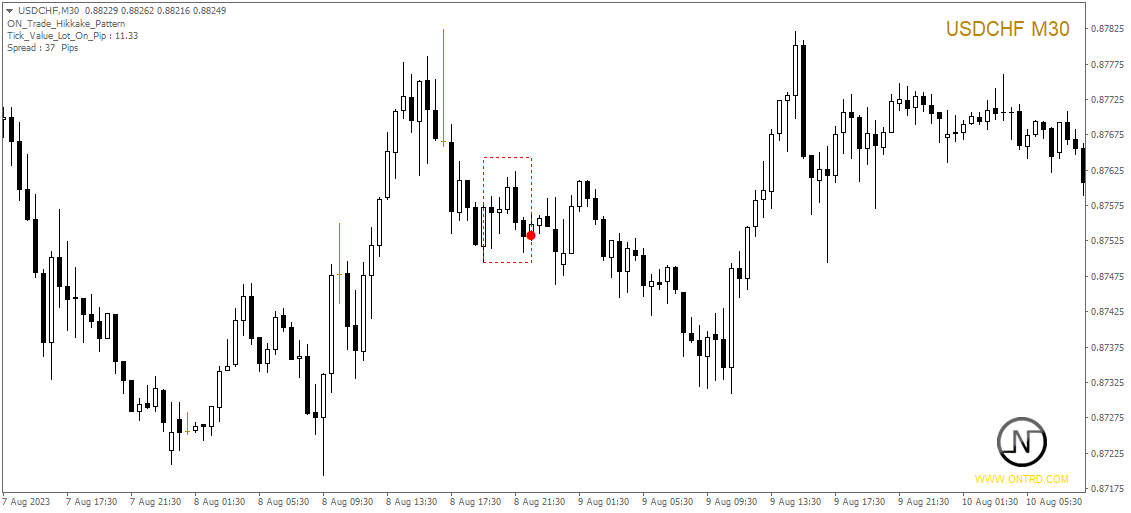
The Hikkake Japanese candle pattern is a specialized indicator designed to identify and detect Hikkake Price Action Patterns that are being formed on a chart. These patterns are based on the concept of a false inside bar break out, which often leads to potential trading opportunities. The indicator's main function is to analyze the last five candles on the chart and determine whether they exhibit the characteristics of the Hikkake pattern. When this pattern is confirmed, the indicator will draw a rectangle around the relevant candles on the chart, making it easier for traders to spot and interpret the pattern.
Key Features of the Indicator:
-
Pattern Detection: The Hikkake indicator is specifically programmed to detect and highlight Hikkake Price Action Patterns. These patterns revolve around the idea of a false breakout from an inside bar formation.
-
Confirmation with Last Five Candles: To validate the presence of the Hikkake pattern, the indicator studies the last five candles on the chart. It assesses their arrangement and relationship to determine if the pattern's criteria are met.
-
Rectangle Visualization: When the indicator identifies a valid Hikkake pattern, it will draw a rectangle around the candles that form the pattern. This graphical representation enhances the visual identification of the pattern on the chart.
Parameter Explanation:
Pips_Between_H_L: This parameter allows you to define the number of pips between the high and low prices of the fifth candle. This value plays a role in determining the criteria for the Hikkake pattern and affects the accuracy of pattern detection.
Hikkake Pattern Explanation:
The Hikkake pattern is a candlestick pattern that revolves around the concept of a false breakout from an inside bar. It suggests that after a period of consolidation within an inside bar formation, price attempts to break out in one direction but fails to sustain the momentum. Instead, it reverses and moves in the opposite direction, creating a potential trading opportunity.
The pattern consists of three main candles:
- The inside bar (bar with a smaller range) serves as the initial bar of consolidation.
- A false breakout candle follows, which creates an impression of a potential trend continuation.
- The reversal candle invalidates the false breakout and signals the actual reversal of the trend.
It's important to note that the accuracy of pattern detection depends on various factors, including market conditions, timeframe, and the specific parameters set within the indicator.
Disclaimer: While the Hikkake indicator can provide insights into potential trading opportunities, it's essential to use it in conjunction with other technical and fundamental analysis tools for well-informed trading decisions. Additionally, practice proper risk management and consider testing the indicator on historical data and in a demo environment before applying it to live trading situations.