Watch how to order a trading robot
Read the Rules before you post an order or execute it
How to Order a Trading Robot in MQL5 and MQL4
See a sample Requirements Specification to order a robot
New orders in the category:
30+ USD
30+ USD
560+ USD
30+ USD
30 - 300 USD
Specification
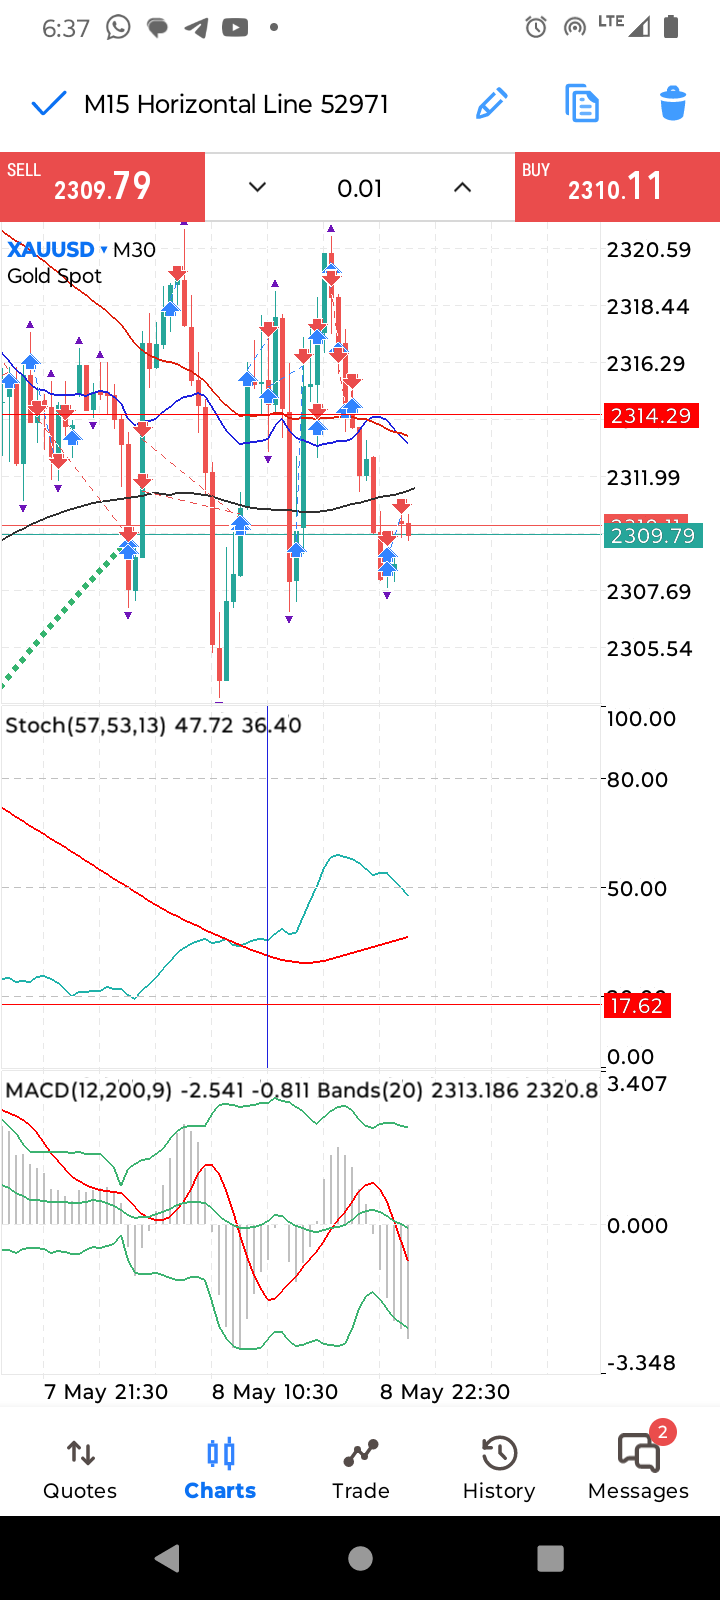
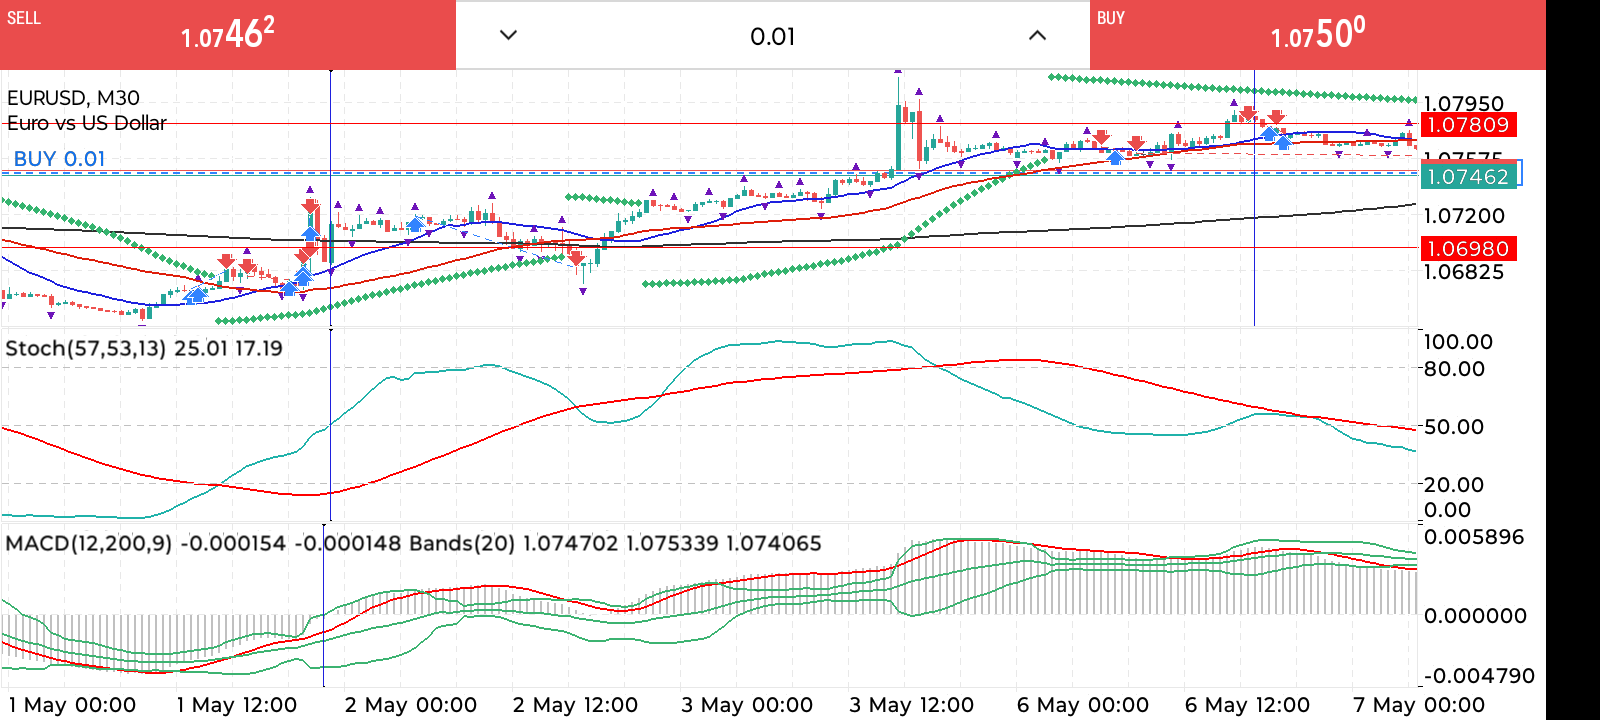
Ii have a manual trading trading I use to trade profitable Two time frame is use Indicators are Moving averages ,,macd,,and stochastic The strategy goes as follows ....on higher time frame window stochastic is concidered ... example 30 min time frame is use for this example ... stochastic on 30 min diverge. Main line dross signal line ()above that is a buy signal (2) 1 min chart is concider as filter ...macg default setting is in the same chart with bollingerband..when macd signal is above bollinger middle band and ma 21 ma is above 50 man That is buy confirmation ....expert open a buy signal ....hard stop loss is triggered when macd signal line fall back on 1 min and cross below lower bollinger band..(hard stoploss will be condition to true or false) in the settings....extra features ....take profit will be added..stop loss ...trailing stop ..breakeven (pips or points) and finally .... expiration...date and lock to account protection first screen shot show 30min stochastic main line crossing signal line up ...buy position...(B) FILTER. Second screenshot shows macd line crossing above bollinger middle band and 21ma crossing 50ma ..OPEN POSITION ....THE OPPOSITE RULE IS FOR SALE....TIME FRAME SHOULD BE SELECTIVE AS A DROP DOWN
Responded
1
Rating
Projects
94
34%
Arbitration
8
88%
/
0%
Overdue
0
Working
2
Rating
Projects
1
0%
Arbitration
0
Overdue
0
Working
3
Rating
Projects
162
41%
Arbitration
5
0%
/
80%
Overdue
8
5%
Working
4
Rating
Projects
195
81%
Arbitration
18
28%
/
44%
Overdue
10
5%
Loaded
5
Rating
Projects
925
48%
Arbitration
301
59%
/
25%
Overdue
123
13%
Loaded
Similar orders
Support And Resistance and CCI EA
560+ USD
The concept is pretty simple and straight forward. When price hit support and form a green candle and the CCI line is either in the over sold level or below the middle/zero line, then it will be a BUY. And when price hit resistance and form a RED candle and the CCI line is either in the over bought level or above the middle/zero line, then it will be a SELL. Now another condition for buy and sell. When price cross
Convert Pine Script Trading view To MT4 Convert Attach Script to mt4 with buy and sell signals on Chart and Data Window. The buy and sell signal must be the SAME signals, on the same candles. No deviation. Must Match BTC 1 hr to buy and sell signals... no deviation
hello 👋 great developer am looking for developer that will help me to convert pinescript strategy to mt4 strategy I will be looking for your bid soon Best regards Ayofe
Hello! I need to make the indicator for Forex Tester 5. The platform supports indicators/strategies/scripts which are written in .dll format and can be created in Delphi or C++ programming languages. Are you interested in the task? In the attached files the Task is explained, and in the file in Excel you can see the formulas and data. The task is to make an indicator for Forex Tester 5. If you want to fulfil the
Rules for price action bot: write me an mt5(mql5) .mq5 code expert advisor with the following rules: rules= 1.strategies-Pin Bar Strategy,Inside Bar Strategy,Engulfing Candlestick Strategy,Breakout and Retest Strategy,Trendline Trading Strategy,Hammer Candlestick Pattern,Shooting Star Candlestick Pattern,Three Inside Up Candlestick Pattern,Three Inside Down Candlestick Pattern,Morning Star Candlestick
THE DEVELOPER MUST NOT HAVE ANY PENDING JOBS TIME IS OF THE ESSENCE I ALREADY HAVE SORUCE CODE, ADD ENTRIES AND CONDITIONS TO CODE I NEED THIS DONE BY TODAY OR TOMORROW MORNING THE LATEST The MT4 EA will work simultaneously on multi pairs the broker has to offer. The opening procedure will begin as follows: In this example I will use a BUY order. The same for SELL order. When the EA is dragged/ double clicked/ added
Hi I bought FXSSI.com tools ( sentiment indicator) including the following indicator: FXSSI.Ratio.ex4 (.mq4 versions are not provided) Now I am trying to export the indicators' output values in an EA in order to generate trading signals and to backtest strategies based on various combinations of some of these indicators but I can't make it work. I use iCustom() but it always returns either: > 2147483647 if
I need someone who would use four moving averages on the mt4 and mt5 platform to create a trading robot The first moving average period would be 10, method is simple, applied to close, The second one is period 30,method is exponential, applied to close, the third one is period 50, method is simple , applied to close. The fourth one is period 200, method is simple and applied to close The 200 has to cross the rest of
PINESCRIPT INDICATOR FOR USE ON TRADINGVIEW.COM
150 - 300 USD
I want to create dashboard Indicator to show data of “Moving Average” and “Break Out Structure” for all time frames My indicator must show data of “Moving Average” and “Break Out Structure” for all time frame For MA, show green you can Inspire and use its original script from this indicator hen MA 10 is above MA200, otherwise show red For the Breakout Of structure, show green for Bullish structure and red for bearish
"Martingale EA base on Stochastic Oscillator"
30 - 70 USD
The strategy is based on identifying overbought and oversold conditions across multiple timeframes. The primary indicator used is the stochastic indicator. Stochastic Settings: • %K period: 100 • %D period: 5 • Slowing: 4 •Price field : close/close For buying: • stochastic Signal line/Both Most be in the oversold zone (20 level of stochastic) on the H4, H1, 30m, 15m, 5m, and 1m timeframes. Final confirmation For a
Project information
Budget
35+ USD
Customer
Placed orders3
Arbitrage count0