Join our fan page
- Views:
- 21641
- Rating:
- Published:
- 2010.01.08 13:53
- Updated:
- 2016.11.22 07:32
-
Need a robot or indicator based on this code? Order it on Freelance Go to Freelance
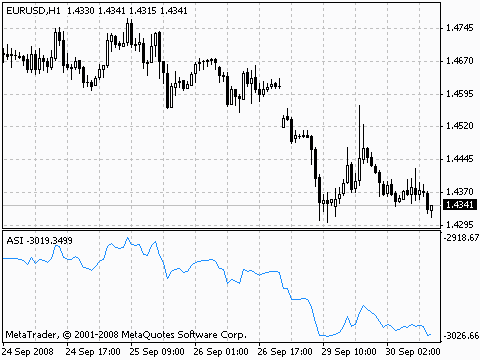
ASI was created by Welles Wilder as an ordinary fluctuations indicator that gets signals from previous maximums and minimums of price. Once, Wilder said: "Somewhere amidst the maze of Open, High, Low and Close prices is a phantom line that is the real market." What helps us reveal this phantom line is the accumulation index.
In his book "New Concepts in Technical Trading Systems", Wilder describes the indicator this way: "When the Index is plotted on the same chart as the daily bar chart, trend lines drawn on the ASI can be compared to trend lines drawn on the bar chart. For those who know how to draw meaningful trend lines, the ASI can be a good tool to confirm trend-line breakouts. Often erroneous breaking of trend lines drawn on bar charts will not be confirmed by the trend lines drawn on the ASI. Since the ASI is heavily weighted in favor of the close price, a quick run up or down during a day's trading does not adversely affect the index."
With the ASI attempting to show the "real market," it closely resembles actual prices. This allows usage of classic support/resistance analysis on the ASI. Standard analysis involves looking for breakouts, new highs and lows, and divergences. Wilder points out the following characteristics of ASI:
- It gives quantitation parameters of price changing;
- It shows the turning points of short-term changing;
- It gives a possibility to understand the real power and trend of the market.

Accumulation Swing Index Indicator
Calculation:
SI(i)=50*(CLOSE(i-1)-CLOSE(i)+0,5*(CLOSE(i-1)-OPEN(i-1))+0,25*(CLOSE(i)-OPEN(i))/R)*(K/T)
ASI(i) = ASI(i-1) + SI(i)
where:
- SI (i) - current value of Swing Index technical indicator;
- SI (i-1) - stands for the value of Swing Index on the previous bar;
- CLOSE (i) - current close price;
- CLOSE (i-1) - previous close price;
- OPEN (i) - current open price;
- OPEN (i-1) — previous open price;
- R - the parameter we get from a complicated formula based on the ratio between current close price and previous maximum and minimum;
- K - the greatest of two values: (HIGH (i-1) - CLOSE (i)) and (LOW (i-1) - CLOSE (i));
- T - the maximum price changing during trade session;
- ASI (i) - the current value of Accumulation Swing Index.
Translated from Russian by MetaQuotes Ltd.
Original code: https://www.mql5.com/ru/code/11
 Adaptive Moving Average (AMA)
The Adaptive Moving Average Indicator is used for constructing a moving average with low sensitivity to price series noises and is characterized by the minimal lag for trend detection.
 Average Directional Movement Index Wilder
The Average Directional Movement Index by Wilder (ADX Wilder) helps to determine the presence of the price trend.
 Average True Range (ATR)
Average True Range Technical Indicator (ATR) is an indicator that shows volatility of the market.
 Awesome Oscillator (AO)
Bill Williams's Awesome Oscillator Indicator (AO) is a 34-period simple moving average, plotted through the middle points of the bars (H+L)/2, which is subtracted from the 5-period simple moving average, built across the central points of the bars (H+L)/2. It shows us quite clearly what’s happening to the market driving force at the present moment.