
Trading Strategy Construction: Evolutionary Approach and Data Mining

In the dynamic universe of trading, I have evolved from intuitive strategies towards a more structured and advanced approach. Currently, I employ specialized strategy generation tools to systematically and efficiently build my trading approaches.
My primary focus has shifted towards creating Expert Advisors (EAs), especially those grounded in grid strategy. Despite the criticisms that have arisen, I have discovered a fertile ground where these strategies can shine.
Recently, I have entered a new phase, exploring more complex strategies that incorporate Stop Loss and Take Profit. I am convinced that this evolution is the path forward in my quest for more robust and effective trading strategies.
Throughout this article, I will share my strategy generation process. This shift towards more advanced tactics reflects my ongoing commitment to improvement and adaptation in an ever-changing market. I invite you to join me on this exciting journey towards a more refined and strategic approach to trading!
Strategy Mining
In the process of creating strategies, I use specialized software for strategy generation through mining.
The logic behind this is as follows: millions of combinations of trading indicators and signals are tested, mixed in a predetermined order, and limits are set. Given the large number of combinations, this process can take several hours or even days. It is tested for a specific time duration, in my case, using a 10-year period.
The process involves a genetic evolution of strategies, subjecting them to verification and out-of-sample periods. It is not brute force mining; I already know what I want when I start. When I initiate the process, I have an idea in mind. In this case, I was looking for strategies for a validated strategy based on Bollinger Bands, considering the bands as support and resistance. It is taken into account that when the price starts breaking the bands, it is accompanied by a level break, and momentum is imminent.
Initially, relatively flexible values are set to guide the evolution of strategies, along with firmer values used to classify and discard many strategies.

What do we observe in this first image? Some interesting things. At the time of capturing the screen, 13 million combinations had been tested, and only 7482 (0.6%) had been accepted according to our criteria. The first test was close to 10 hours at this point. 48 building blocks had been selected, and a test was being conducted for 10 years of GBPUSD. However, tests were also being conducted on EURUSD, to subsequently discard those that did not perform well on both symbols.
It might be thought that our work is complete by obtaining more than seven thousand strategies that meet apparently suitable retrospective criteria. However, what is to come is essential to discard mere chance, over-optimization, or precise parameter fitting that could lead to misleading results. We will explore a series of additional tests to ensure the robustness of our strategies.
Robustness Tests
Robustness tests are diverse and challenging, but we highlight some of the methods used:
- Randomize Start Bar: How does our strategy behave when the test starts at a different bar? We will discover if the strength of our strategy lies in its independence from the initial position of the test.
- Randomize Strategy Parameters: Strategies depend on specific parameters, but what happens if those parameters undergo small variations? We will evaluate the resistance of our strategy to subtle changes, maintaining the excitement of uncertainty.
- Randomize Historical Data: Can our strategy withstand changes in historical data, or is it too tied to a specific past? We will explore how it performs against variations in historical data, challenging excessive dependence and ensuring a more comprehensive view.
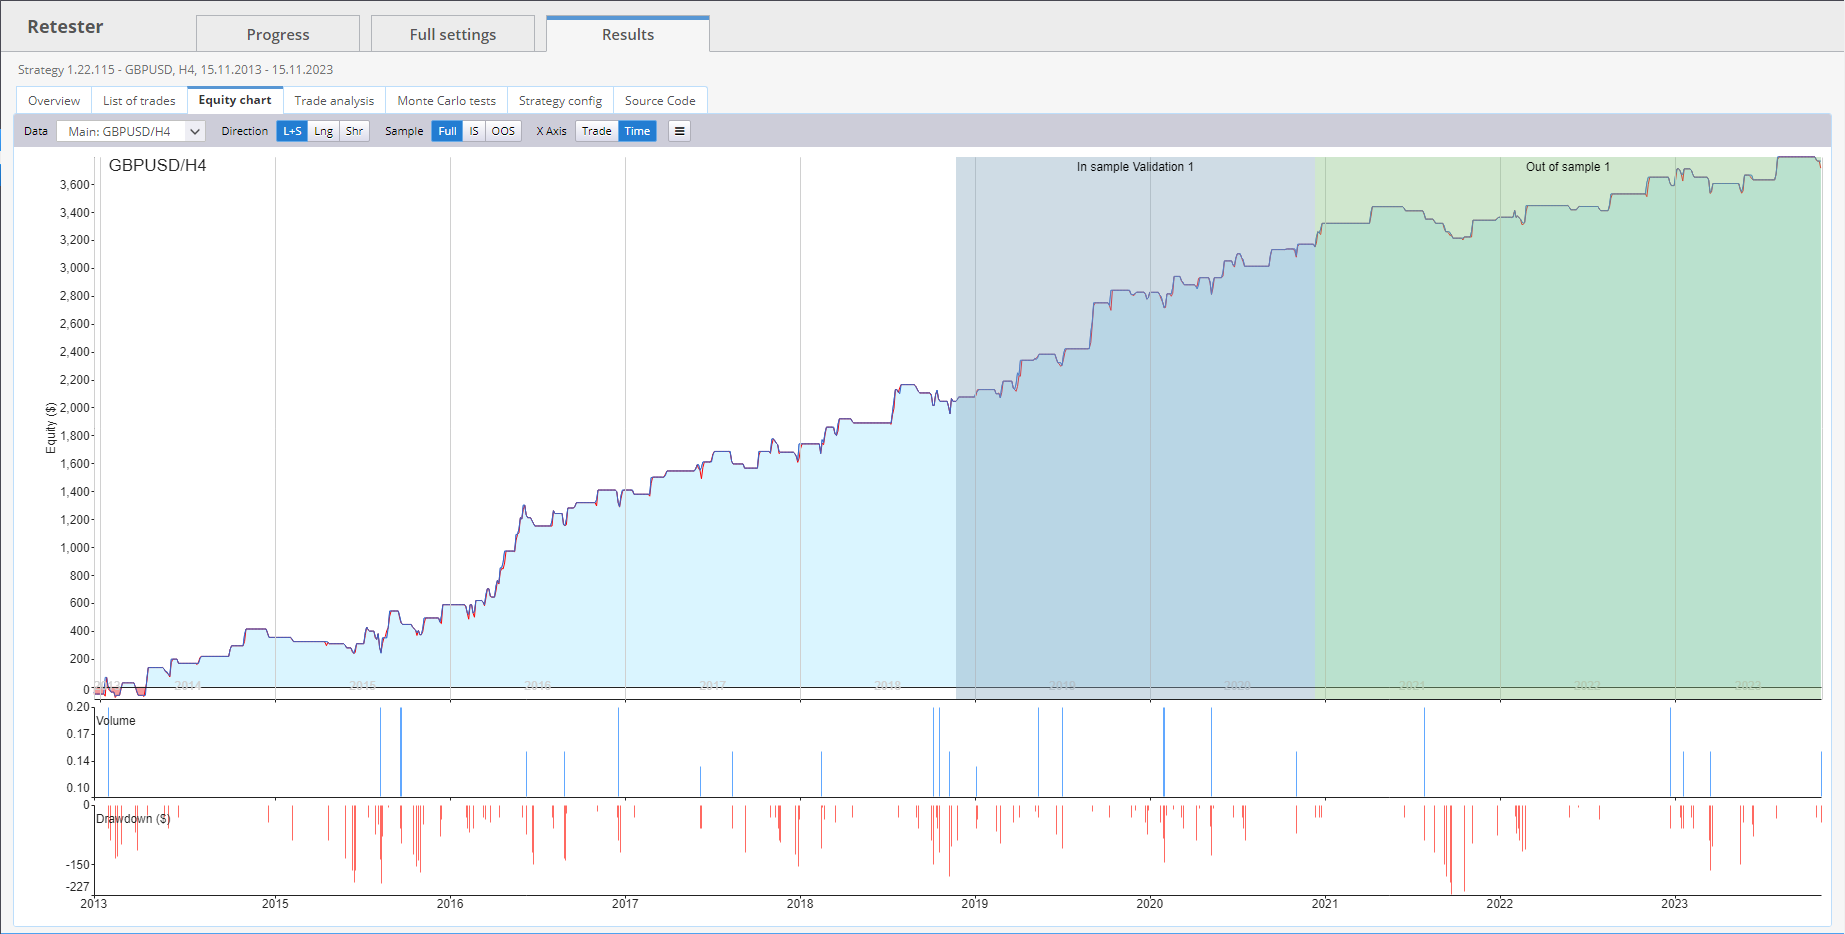
Let's illustrate with a clarifying example. In the image below, we see an equity chart, which is even increasing in the out-of-sample period (green period). We would think it's a good strategy, robust, natural, and uniform:
However, after applying 200 variations to the special circumstances where it develops—quote, spread, slippage, parameters—we see this in the Monte Carlo test:
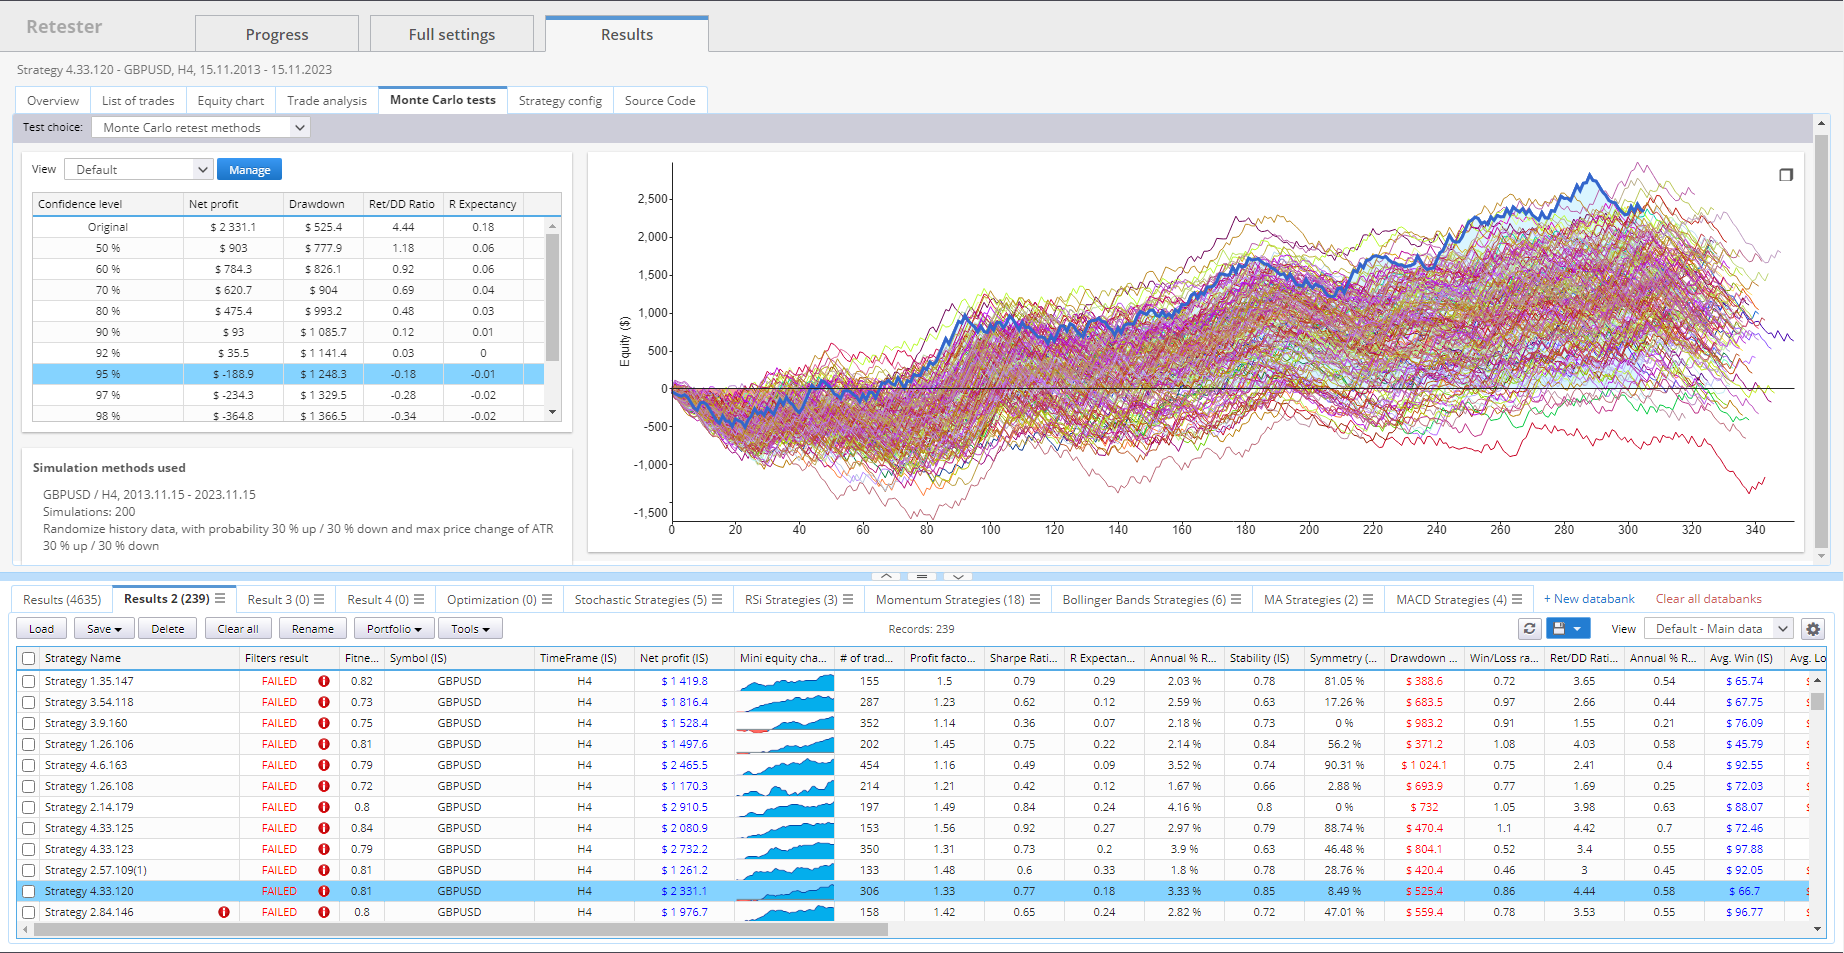
Explanation of the image: In dark blue, we see the original strategy, and around it, all the variations that have occurred after the tests. Virtually the best result is the original test, and the rest of the results are worse, with a large number of variations with loss results. This strategy that could seem good is automatically discarded at this stage.
But let's see how a favorable Monte Carlo test would look like:
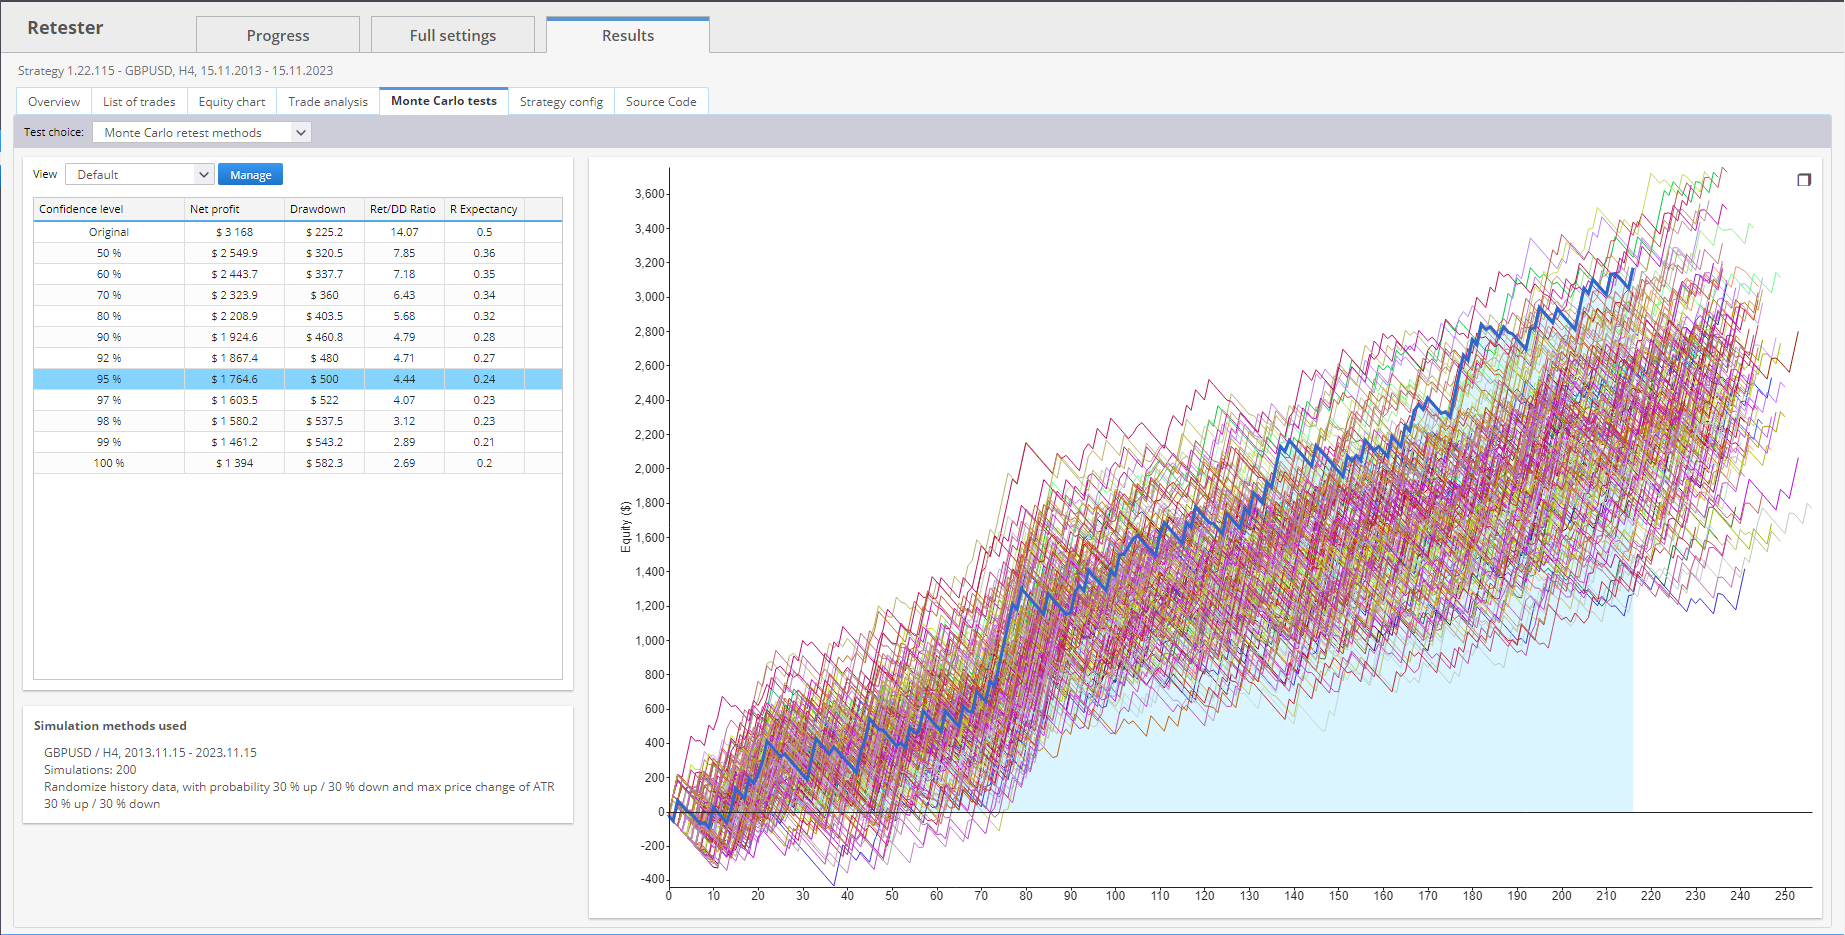
In this test, the variations move in parallel, with profit results. This is telling us that this strategy can be robust.
But testing doesn't end here. We still have hard work ahead, as we must subject the tests to a Walk Forward Optimization process and a Walk Forward Matrix.
Walk Forward Optimization
Walk-Forward Optimization is a special backtesting technique that involves conducting multiple smaller backtests in optimization periods. These periods are spread throughout the entire backtesting period and are always followed by out-of-sample tests with optimized parameters.
In the Walk-Forward optimization process, data is divided into configurable periods, and each period includes an optimization part and an execution part. Optimization is performed on a past segment of data, and then the performance of the system is verified by forward-testing it on data following the optimization segment.
This technique simulates how you would work with the strategy during real trading, optimizing it on historical data and then operating it with optimal values. If the strategy does not improve during reoptimization, it could indicate curve-fitting. On the other hand, if the Walk-Forward optimized strategy outperforms the non-optimized version on the same data, it suggests that the strategy will benefit from periodic optimization and is robust enough to adapt to market changes.
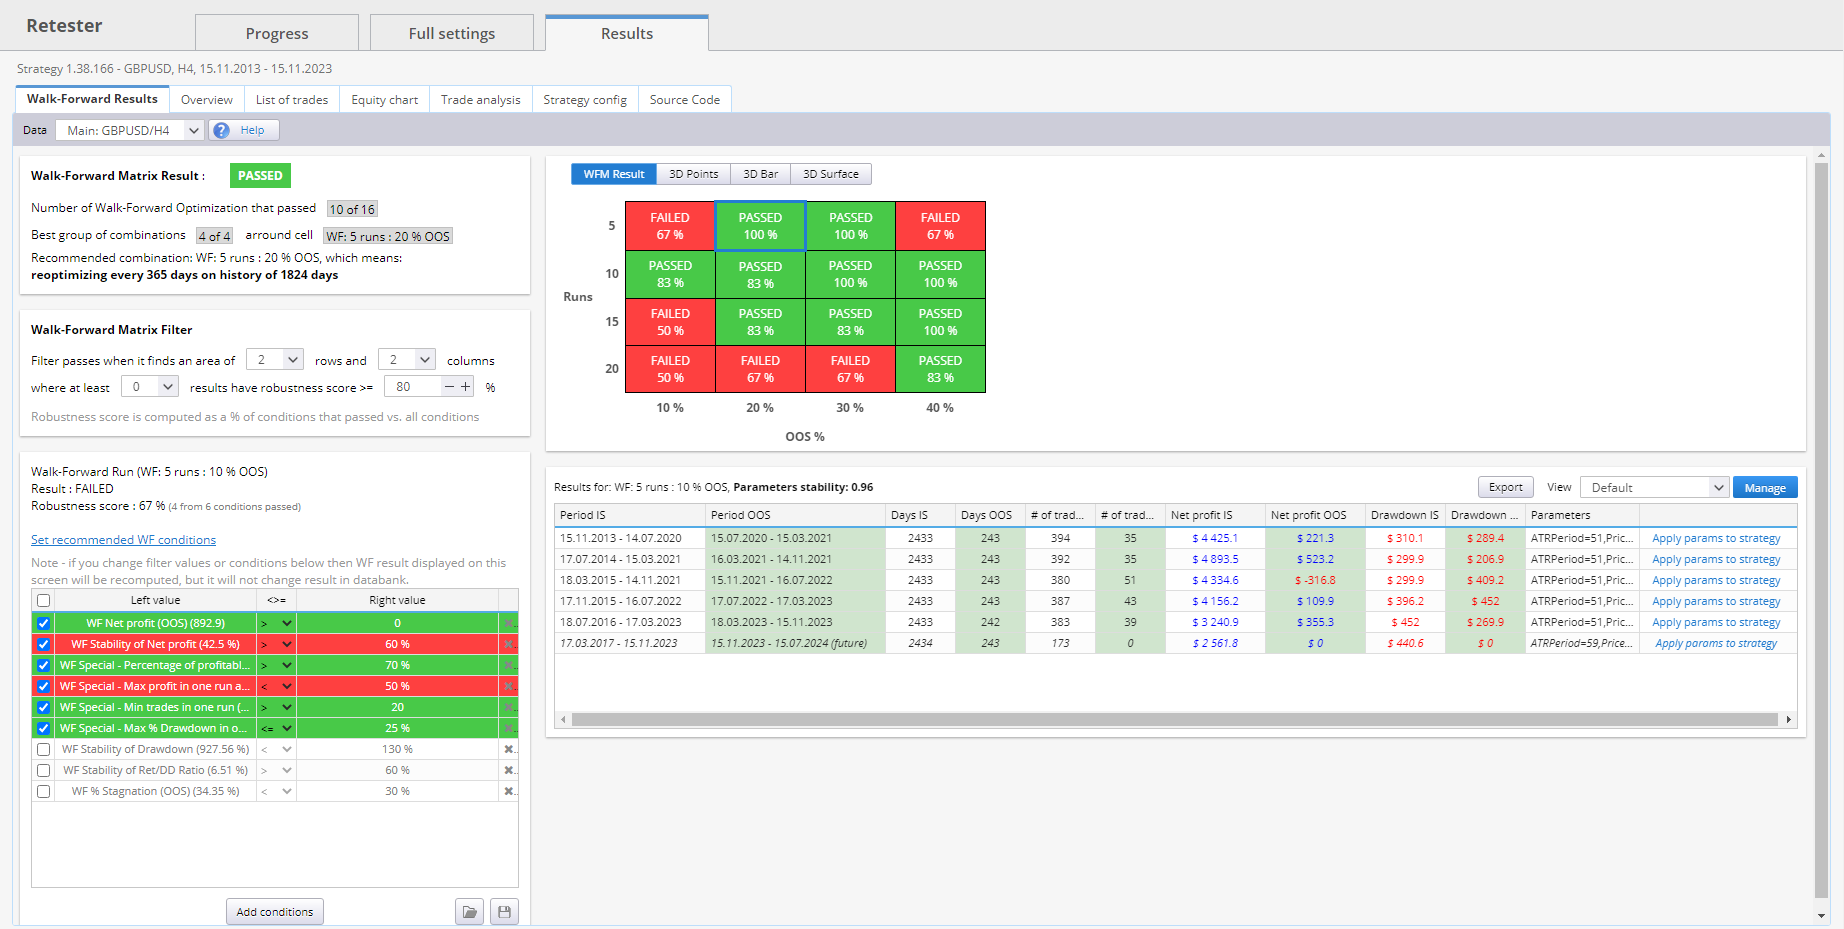
Walk Forward Matrix
It is simply a set of Walk-Forward optimizations performed with different numbers of reoptimization periods and different percentages out of sample.
The result of the Walk-Forward Matrix is presented in a table and a 3D chart that shows the scores (robustness results) for all combinations of out-of-sample percentages/executions performed in this matrix. This information will be explained in detail at the end of the article, but before delving into that, let's start with a complete example.
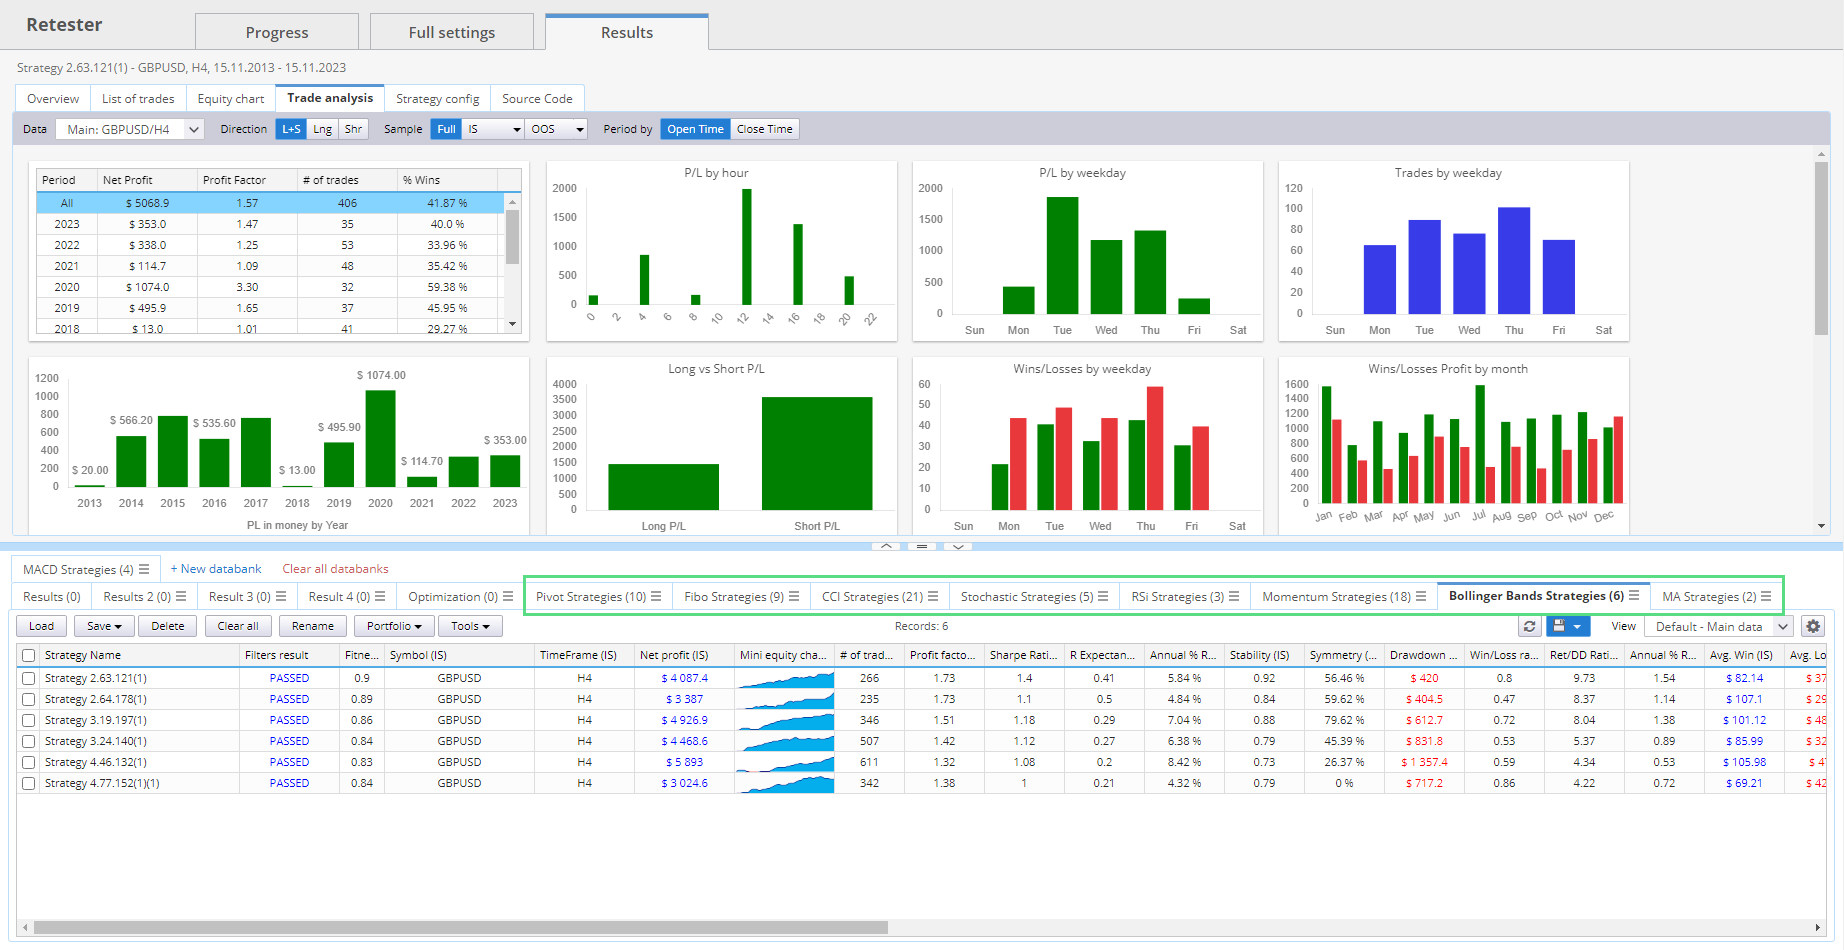
Ultimately, and although the theory may be challenging, what we are interested in is selecting strategies that pass the tests. The results of these tests are represented in this way:
And although at this point, most might think that we have finished the process, right now we have 6 strategies that we will analyze manually, understanding the logic behind them, and comparing them with others.
Our approach is to build a portfolio with different strategies that before starting the process, we were certain could work, and that after several steps, we have refined them to have a strategy that can be part of a portfolio that compensates for bad times with the good ones from other strategies. And as we see in the image below, we have in different folders, strategies based on certain more or less differentiated trading elements to make the portfolio as robust as possible:
We can refine the process much more by optimizing the strategies individually, although this step does not interest us initially. In this last image, we see an example of a portfolio of 9 strategies, which, as we have seen, have been selected from millions, and that combine different indicators and signals, and above all, that work well in out-of-sample tests, giving us some confidence in thinking that it can be a good starting point for an even larger portfolio of different symbols.


