
Trade in the direction of the trend using the Owl Smart Levels strategy

My strategy is based on classical trading fundamentals and refinement of indicators widely used in all kinds of markets. The principle of working according to the trend and using proven indicators included in the interface of popular trading terminals make it up-to-date and convenient for using in all markets and trading platforms. The strategy is based on the principle of simultaneous combined use of several indicators.
Some of them have been refined and modified, and their further work has been tested in practice for a long time. This represents a complex trading system or smart-strategy, which has a very good risk/return ratio. All the necessary parameters described above are combined in a new indicator called Owl Smart Levels which displays the resulting parameter of the work of all the parts of the trading system in interaction. I named my strategy Owl because I associate the owl with wisdom. In fact, I made an attempt to combine well-known classic tools so that they could be used together as correctly as possible.
Basically, this is a ready-made tool, using which you can fully work on the proposed new profitable trading strategy.
Contents:
Introduction
1. Profitable trading - trading in the trend direction
1.1. How to determine the trend correctly?
1.2. What is the difference between a global trend and a local tendency?
1.3. Trading by trend2. The set of tools of the Owl strategy and their construction
2.1. Fractals
2.2. Valable ZigZag
2.3. Fibonacci levels3. Trading strategy
3.1. The basic principles of the Owl strategy
3.2. StopLoss and TakeProfit levels
3.3. Triple Screen method by A. Elder
3.4. Dead zone4. Additional tools and entry points
4.1. Sloping channel
4.2. Fibonacci Fan5. Money management
Conclusion
Introduction
It is commonly known that to trade at the markets a trader needs psychological preparation, financial calculation and trading strategy. Psychological preparation is aimed at discipline, stress-resistance, clear self-esteem and emotional intelligence. Financial calculation makes it possible to optimally allocate available resources and not only minimize risks but also to correctly handle them, sometimes by a justified increase. A trading strategy is the very technical methodology that a trader uses in his work. This complex concept includes a lot of constants and variables. These are indicators, charts of different timeframes, forecasted time of beginning and end of a trade, hedging, change of trading lot volume and many other things.
If one of these three components will be removed: psychological preparation, financial calculation or trading strategy, nothing will work out for the trader. In this article will be detailed description of one of them, the new trading strategy Owl, which consists of five parts including analysis of classical indicators, their modification, description of trading techniques and, of course, illustrations.
1. Profitable trading - trading in the trend direction.
The fundamental basis of trading on the stock exchange is the ability to correctly determine the global trend - the direction of price movement and movement of money in one or another asset for a maximum time interval. Trading in the established global trend is the main factor for successful profitable trading.
What is a trend?
All changes on the market are the consequence of money movement which is fixed by the change of prices. Thus, the markets are driven by money and the more money flows into the market the more demand increases and, accordingly, the price increases in an upward trend, and vice versa, if money begins to leave the asset, demand decreases and the price falls which is reflected in a downward trend on the chart.
1.1 How to determine the trend correctly?
The sign of a trend is really simple: it is the constant updating of the maximum and minimum values of a wave-like movement of the price chart in an upward or downward direction. You can see this in any market, on the chart of any asset.
Charts move in a wave-like manner, entering overbought and oversold zones or from correction to continuation of the trend, and vice versa. If the price maximums are constantly updated and the support levels on the reverse corrections are higher than the previous ones - there is an upward trend (Fig. 1.) and the demand for the asset continues to increase.
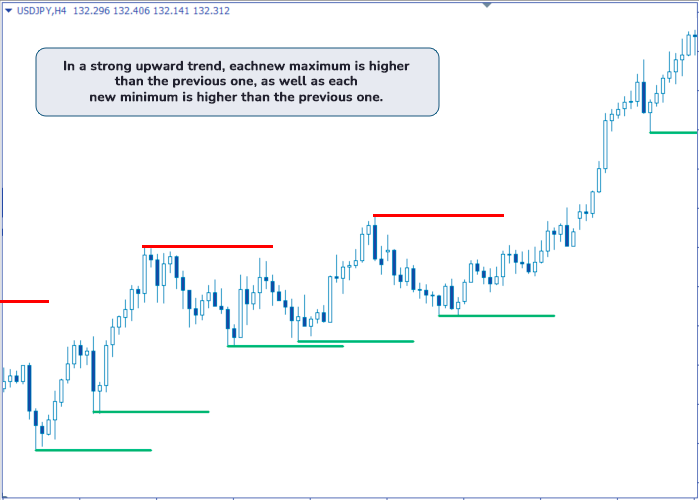
Fig. 1. Upward trend
If the price minimums are constantly updated and the support levels on the reverse corrections are lower than the previous ones - the downward trend remains and the demand for the asset continues to decrease (Fig. 2.).
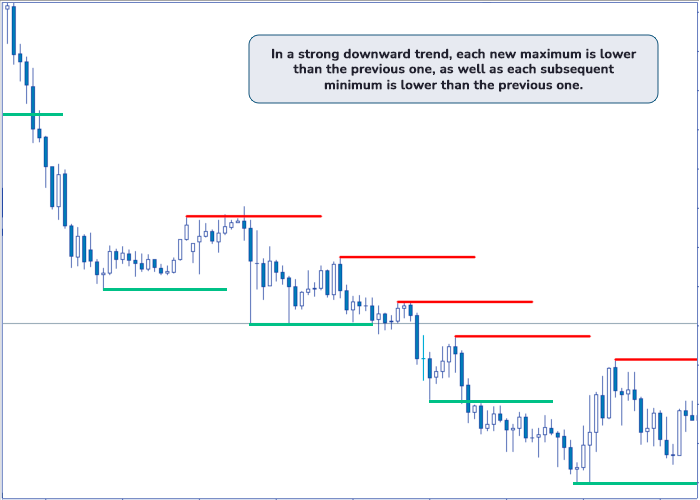
Fig. 2. Downward trend.
The correct determination of the global trend allows to find optimal market entry points for making profitable trades.
1.2 What is the difference between a global trend and a local tendency?
There are two most important factors to distinguish between a local tendency and a global trend. The first factor is a significant change in price, allowing the trader to make a profit on buying and further selling. The second one is the duration of the price range change over time. A systematic rise in price and a corrective trend to it are most clearly seen in scale. The tendency is always much shorter than the trend in the chart segment and, correspondingly, in the time range (Fig. 3).
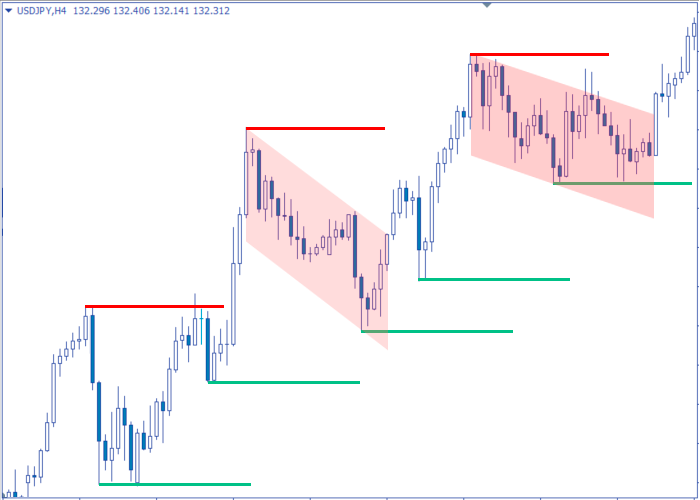
Fig. 3. Downward local tendencies.
If we plot the visual representation of the borders of a channel or trend, we will clearly see that the tendency is always within these limits and does not break the channel borders, while the trend breaks all the borders when it changes its direction.
An indication for distinguishing between a tendency and a trend is scale: a tendency is always several times smaller than a trend in terms of its scale.
1.3 Trading by Trend
Why is it worth to trade by trend? If money is "moving" in a certain direction they need some time in any market to redistribute themselves. A global trend reversal does not happen immediately.
The difficulty of finding the moment or entry point into the market is to reliably identify a trend reversal or a rebound from a support/resistance level after a corrective trend.
Why is it necessary to trade only by the trend? First of all, because the trend is prolonged while the local tendency against the trend can be small. If the market entry point is chosen incorrectly while trend trading and during the correction the market turns against the trader, the rebound and continuation of price movement along the trend will allow the trader to go out of the drawdown into the profit, in case of smart money management and trades hedging.
If StopLoss triggers at the moment of trend reversal and the trade closes with a loss, the trader can open a new trade of larger volume to compensate for the losses and come out with a profit.
Understanding what is going on in the market gives additional advantages for the profit and only the trend can be used as a starting point.
There is also counter-trend trading which allows one to make profit during correction. Its feature consists in the short-term deals in comparison with deals on a trend. Nevertheless, to trade on a correction, the trend is determined in any case, its relatively short-term nature is taken into account and this becomes the exception that only confirms the rule. That is why it cannot be called a counter-trend trade in the direct sense of the word, it is performed only at inverse correction sections.
Trading by trend and correct determination of points not only for entering but also for exiting the market, closing trades allows to be at a long distance from the shocks associated with market reversals, and remain in the statistical benefits.
In addition to the upward and downward trend types, there is a horizontal movement of the market on the chart in the so-called "sideways" or "flat". The wavy price movement here goes in a horizontal channel of minimum and maximum values.
Understanding the principle of trading by trend makes it possible to minimize the risks of financial losses and it is the basis for the development of real and effective trading strategies.
2. The set of tools of the Owl strategy and their construction
2.1 Fractals
The trading indicator "Fractal" was created by the famous market trading theorist Bill M. Williams (1932-2019). A fractal is a graphical combination of five bars or candles indicating the strength of buyers or sellers at a certain point in time. Some bars or candles may be on the same level, but as a rule, five adjacent candles with different levels are used to determine a fractal, among which there should be two candles on the left and on the right from the highest - high - in an upward trend, or from the lowest - low - in a downward trend.
The interface of the MetaTrader 5 and 4 trading platforms has a preinstalled Fractal indicator which can be easily adjusted at any timeframe. Some traders compare Fractal with the human palm where the upper or lower, depending on its direction up or down, can be the middle, the longest finger (Fig. 4).
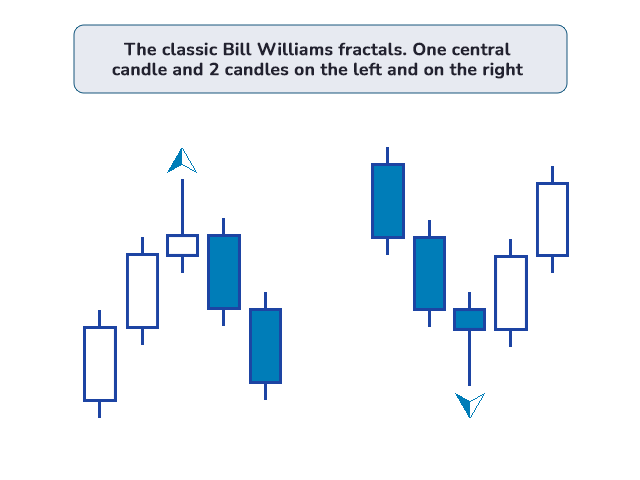
Fig. 4. Classical fractals by B. Williams.
The fractal is marked on the chart with the arrow; by the fractal line you can clearly see the direction of movement and characteristic changes in price movement, as well as determine the support and resistance levels.
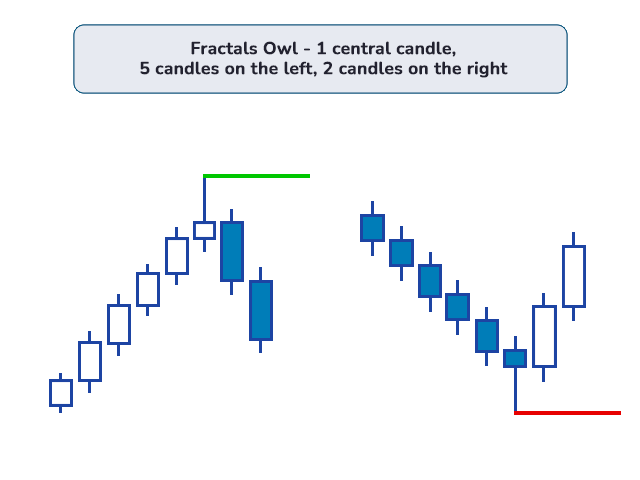
Fig. 5. Fractals in the Owl strategy.
The definition of a fractal in the Owl strategy is different from the classic one. In the Full Fractals Indicator, in order to index a fractal, the last five candles are taken to the left from the high or low candle, unlike the classic two, and to the right two candles are taken (Fig. 5).
All fractals in the Owl strategy are marked with short horizontal colored lines.
2.2 Valable ZigZag
The wave nature of the market was once carefully developed by Ralph Nelson Elliott (1871-1948), an American financier who created the wave theory that interprets the financial markets through a system of visual wave patterns on price charts.
The ZigZag indicator, on which we will focus in more detail, allows us to understand the wave-like market movements. The proposed version of the ZigZag by the Owl strategy contains a smaller number of bends, thus enlarging the wave.
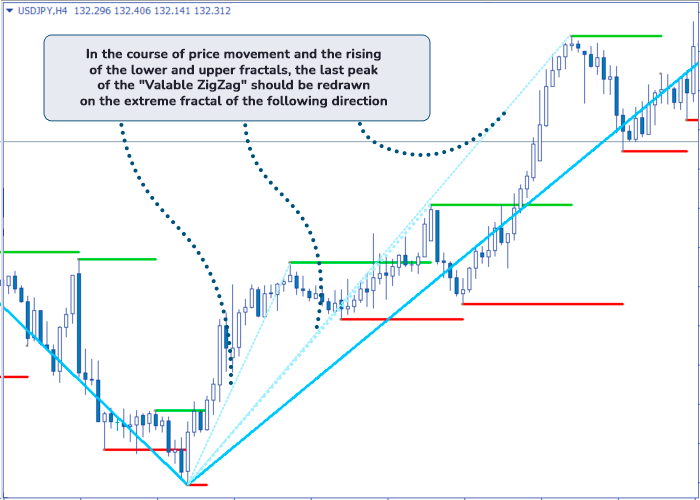
Fig. 6. Valable ZigZag.
The ZigZag determines the main trading direction. The work of the indicator and its correct determination on the chart is closely connected with the previous indicator - the fractal. As fractal maximums or minimums shift in the trend direction, the line of Valable ZigZag does not change its direction, unlike the classic one (Fig. 6).
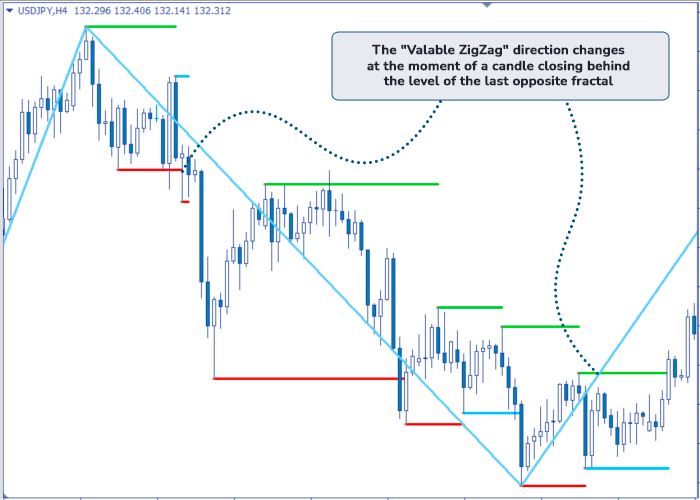
Fig. 7. Change of direction of the Valable ZigZag.
Thus, the Valable ZigZag combines several movements within the trend into one and does not change as long as maximums/minimums of the fractals move in the direction with the ZigZag. In order to change the direction of the ZigZag, a candle must break out the level of the previous fractal candle in the opposite movement and get fixed above or below that fractal (Fig. 7).
Since the ZigZag indicator sets the trading direction, its upward direction will mean trading only to buy, and its downward direction will mean trading only to sell.
2.3 Fibonacci levels
Fibonacci levels or Fibonacci Grid is present in the arsenal of almost every trader, as it shows very good trading results in the stock market, FOREX and the cryptocurrency market.
This indicator is based on the sequence of numbers discovered by the Italian scientist Leonardo of Pisa (ca. 1170 - ca. 1250), one of the first major mathematicians in medieval Europe. The basic principle of the sequence is that the first two numbers in it are equal to 0 and 1, and each subsequent number is equal to the sum of the previous two.
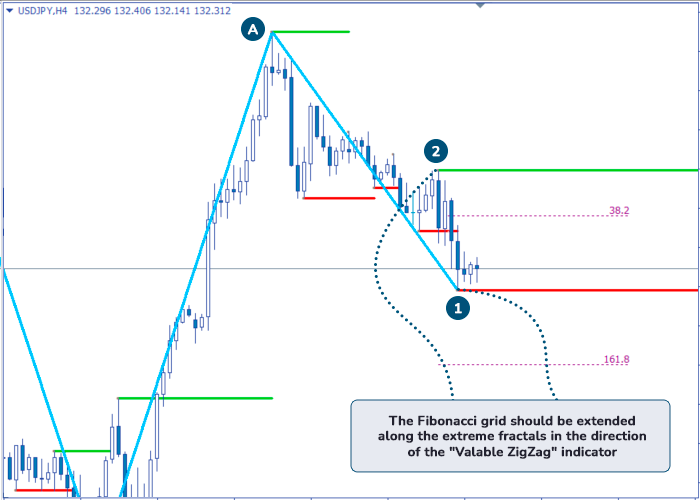
Fig. 8. Fibonacci Grid set by a downward trend. А - change of direction of the Valable ZigZag. 2 - upper Owl-fractal or "0" level of the Fibonacci Grid. 1 - lower Owl-fractal.
The Fibonacci Grid stretches from the fractals that testify to the beginning of a corrective movement capable of turning into a trend change. Numerical values of levels such as 0; 23.6; 38.2; 50; 61.2; 161.8 correspond to the mathematical sequence discovered by the Italian mathematician. The number 161.8 indicates the level of the golden section and shows that the maximum movement in one direction was occurred and that the backward correction can happen soon. If the price reaches this level, it is possible to take a profit and readjust the Fibonacci Grid some time later.
The particularity of applying the Fibonacci Grid in the Owl strategy is that the indicator is used in an inseparable connection with the Valable ZigZag indicator and the Owl version of the fractal.
The Fibonacci levels grid should be adjusted between two opposite fractals located to the right of the trend change point according to the Valable ZigZag indicator. If it is directed upward, to buy, then the level 0 is set at the point of the extreme lower fractal and the level 100 is set at the point of the extreme upper fractal. If ZigZag is directed downward, to sell, the Fibonacci Grid is extended from the outermost upper fractal with the 0 level to the outermost lower one with the 100 level.
It is possible to enter the market at levels 38.2; 50; 61.2 and if the trend change is determined correctly, there will still be enough movement on the chart up to the level of 161.8 to make a profit.
If the trend is not strongly defined and is tend to flat, it is possible to enter the market at levels 38.2, 50, understanding that the price may not reach the level of 161.8 and trying to fix profit at other, earlier, levels of the Fibonacci Grid. If the trend is clearly defined, the level of 61.8 will be the best entry point, whereas the market may not reach the 38.2 level and a number of possible profitable trades will be missed.
3. Trading strategy.
3.1 The basic principles of the Owl Strategy
The Owl strategy is based on the simultaneous use of several indicators: ZigZag, Fractal and Fibonacci Grid. At the same time, the Fractal indicator is modified and contains eight candles instead of five. The ZigZag indicator has a smaller number of bends since it is only used for determining the trend direction and is called Valable ZigZag in the strategy.
A trading signal appears only when certain positions of adjacent fractals on the chart relative to the Valable ZigZag allow to plot Fibonacci levels.
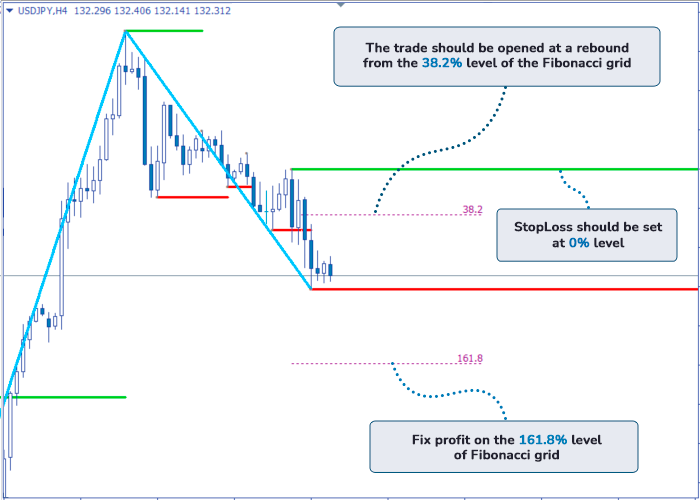
Fig. 9. Trading based on the Fibonacci Grid. А - change of direction of the Valable ZigZag. 2 - upper Owl-fractal or "0" level of the Fibonacci Grid. 1 - lower Owl-fractal.
It is possible to enter the market from one of the levels 38.2, 50 or 61.8. The entry point should be chosen relative to the market dynamics which in any case should be determined before entering it. If a good market movement has started, it is necessary to enter from 61.2, because a number of profitable trades can be missed when entering at 38.2. If the trend movement is not strong, it is better to enter from 38.2. On the stock market - commodity financial instruments and stocks, the level of 50% of movement works very well (Fig.9).
3.2 StopLoss and TakeProfit levels.
StopLoss should be put behind the zero line of the Fibonacci's Grid for 2-5 points, and TakeProfit level is 161.8. You can close the order not in full but at the level of 50% of 161.8, i.e. close 50% of position or half of the order volume, the remaining part should be closed when the direction of Valable ZigZag changes (Fig. 9).
At the level of 100% of Fibonacci Grid the orders should be moved to the breakeven position: the StopLoss level should be set at the opening level +1 point to cover the commissions.
3.3 Triple Screen method by A. Elder's.
The method of triple screen of the well-known and most experienced trader Alexander Elder (born in 1951) consists in the fact that for making trading decisions, charts on three timeframes are studied simultaneously: the main one, where the trade is done, and two timeframes, each of which is four times higher than the previous one.
For example, if you trade on the chart with the timeframe M15, then to confirm the direction of the market, the charts with the timeframes H1 and H4 are connected.
The direction of the main trend determined by the Valable ZigZag Indicator is important. If the direction coincides on all timeframes it means the possibility of finding the main entry signal with the formation of the Fibonacci Grid.
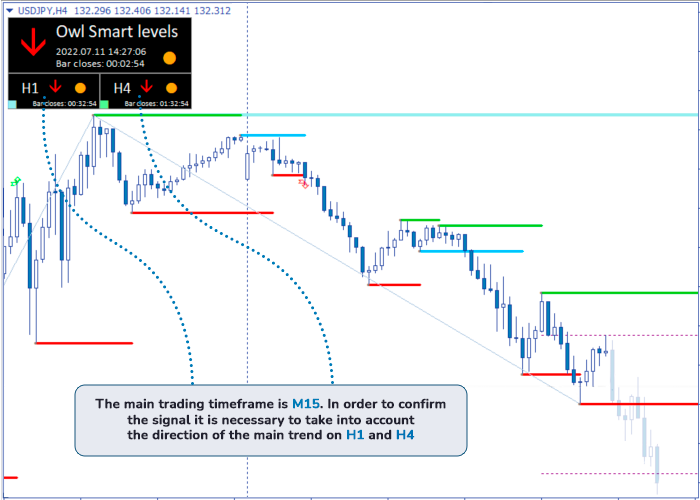
Fig. 10. Price direction displayed on the indicator by three timeframes.
Thus, if the Valable ZigZag and the M15 timeframe show an upward movement direction, H1 shows an upward movement direction and H4 shows the same vector - this means that the probability of this movement remaining for some time is maximal, the market is going up and it is possible to follow the market direction and take profits in case trading by trend. In order to do this, we need to find fractal 1 and fractal 2 located to the right of the change of direction, stretch the Fibonacci Grid and enter the market.
The Elder's method is described in more details by the author himself, but in the Owl only its main principle is applied.
3.4 Dead zone
A dead zone is formed when the movement on the charts in timeframes H1 and H4 is in different directions. On the chart with one timeframe the movement can go upward while with another one it can go downward.
This is a zone in which, relatively speaking, the market is undecided and to enter at this time, both to buy and to sell, does not make sense and is risky enough, it is better to wait until the market comes out of this zone and shows a clear direction. After that, you can look for entry points into the market.
The Owl Smart Levels Indicator shows the dead zone in red, warning you that trading in it is undesirable.
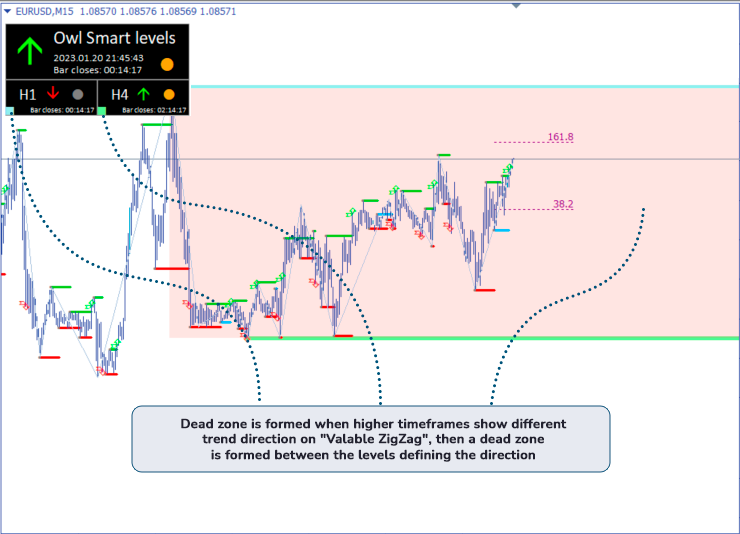
Fig. 11. Dead zone.
4. Additional tools and entry points
4.1 Sloping channel
The Owl strategy assumes an additional tool for working with a price chart such as a sloping channel. Like the Valable ZigZag, it is plotted using fractals in the direction of the trend. To plot the line of the upper border of the channel, it is necessary to take the points of two peaks of the upper fractals; to plot the parallel line of the lower border, it will be enough to take one, the third point of the lower fractal.
Thus, if there are two upper fractals, which are situated to the right of the point of change of the trend direction according to ZigZag, and there is a third, lower fractal situated between them, we can easily create a channel. On this channel, directed upward, you can look for additional entry points to buy (Fig. 12).
When the chart moves the price downward with the corresponding direction of the Valable ZigZag indicator, it is necessary to identify two lower fractals to draw the lower boundary line, and one upper fractal to draw the upper boundary line of the channel, parallel to the lower one.
4.2 Fibonacci Fan
After the channel is plotted one more additional tool can be used along with the channel - the Fibonacci Fan. It is important to note that if the channel is not used in the Owl strategy, the Fibonacci Fan is not used either - these tools for operating with the chart are plotted one relative to the other.
The Fibonacci Fan consists of several rays fanning out from the main ray to the right and, like the Grid, has values corresponding to the Fibonacci numbers sequence - 38.2; 50; 61.8.
The Fibonacci Fan is, in a sense, a leading indicator and gives an early backward signal for a reversal. Its rays represent, relatively speaking, additional support levels in respect to the sloping channel. If the price "breaks through" the fan and goes further away from it, we should not open a trade on reversal from the channel line. In this case we can trade on the reversal from the main trend, because as a rule, when the fan is broken through, it definitively confirms the breakout of the corresponding channel border.
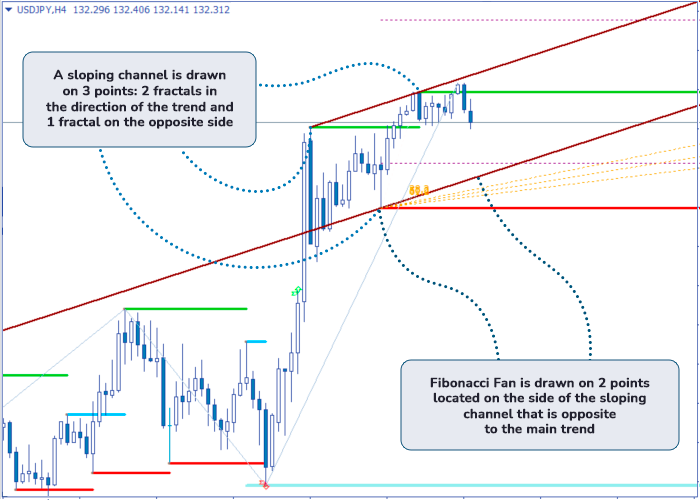
Fig. 12. Sloping Channel and Fibonacci Fan (in yellow).
If the price "rebounds" from the fan, there is an opportunity to enter the market when the trend reverses or tendencies appear, earlier than most traders who use only the sloping channel or even the Fibonacci Grid do, and even earlier than the ZigZag indicator turns over.
5. Money management.
The basis of entering any market is a well-thought and planned money management. It is literally more important than choosing a trading strategy.
Determination of optimal deposit and trading lot volume is necessary in order to solve the main task of a trader - to keep the deposit. If the objective of keeping the deposit is solved, and a trader earns profit, even a small one, it means that the trader trades successfully and he is a successful trader. There is no need to strive for the exaggerated percentage of profitable trades, such as 70-90%, and overstate the corresponding risks in your trading strategy. Many large traders steadily earn on the market with the percentage of profitable transactions not much more than 50%. If the strategy is effective and competent, it will bring its own benefits. You should not interfere and reduce the volume of transactions after the losses, as well as try to catch up by unreasonably inflating the volume of lots.
Initially, it is enough to put minimum risks for a series of 10 losing trades and for the amount not exceeding 15% of the deposit. The probability would seem to be small, but it should never be forgotten about possible market crashes and sudden corrections. Many traders do not take into account the possibility of a long series of losing trades, while this is one of the main reasons why they ultimately lose their entire deposit. Therefore, the amount of deposit should be sufficient to overcome the drawdown, and this does not mean huge, but it does mean that there is a certain ratio of deposit size and trading lot volume.
To come out of a drawdown, it is possible to try gradually increasing order sizes when market behavior becomes clear, as the probability of the next trade to be profitable only increases with every losing trade before it.
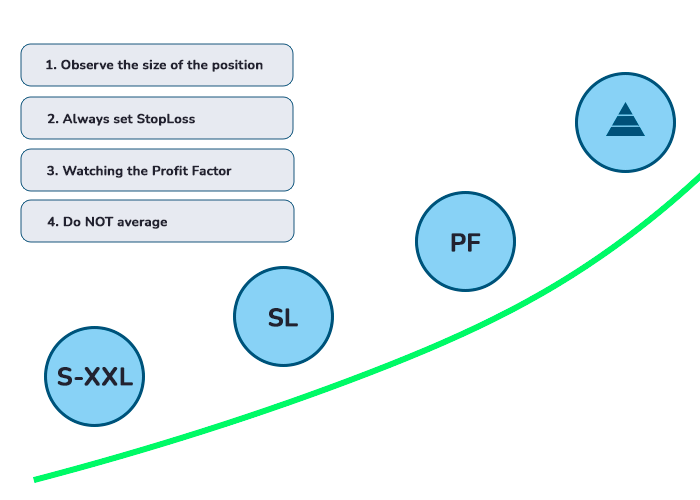
Figure 13. Money management Rules.
The Owl strategy has a rate of return at least two times higher than the objective loss ratio. That is why even having such a ratio of profitable trades to losing trades as 1:3, it allows traders to stay in positive positions and save the deposit. It's important to understand that any tool should work in skilful hands and the system of risk-management is still of primary importance for those who enter the market with the Owl strategy.
Conclusion.
For the Owl Strategy development there were used fragments of the trading system by the world famous trader Bill Williams, elements of the wave analysis theory by the famous trading analyst Ralph Elliott, and also tested by many traders in practice and very popular indicators: Fibonacci Grid and Fibonacci Fan, as well as ZigZag. The strategy also includes Alexander Elder's trading principle - the method of simultaneous use of three screens.
The modification of classical indicators implemented in the Owl, does not change their essence, but dynamically adapts them to the changing market conditions at the current stage. Just as not all of the classical candle models work, at least on different markets, some indicators can at least work with a lag, making their use in modern trading less useful than it would be desirable.
The Owl strategy is based on the principle of simultaneous combined use of several indicators. Some of them have been refined and modified, and their further work has been tested in practice for a long time. This represents a complex trading system or smart-strategy, which has a very good risk/return ratio.
All the necessary parameters described above are combined in a new indicator called Owl Smart Levels which displays the resulting parameter of the work of all the parts of the trading system in interaction. Basically, this is a ready-made tool, using which you can fully work on the new profitable trading strategy described above.


