

Inspired from,
Time is the most important factor in determining market movements and by studying past price records you will be able to prove to yourself history does repeat and by knowing the past you can tell the future. There is a definite relation between price and time. -William Delbert Gann
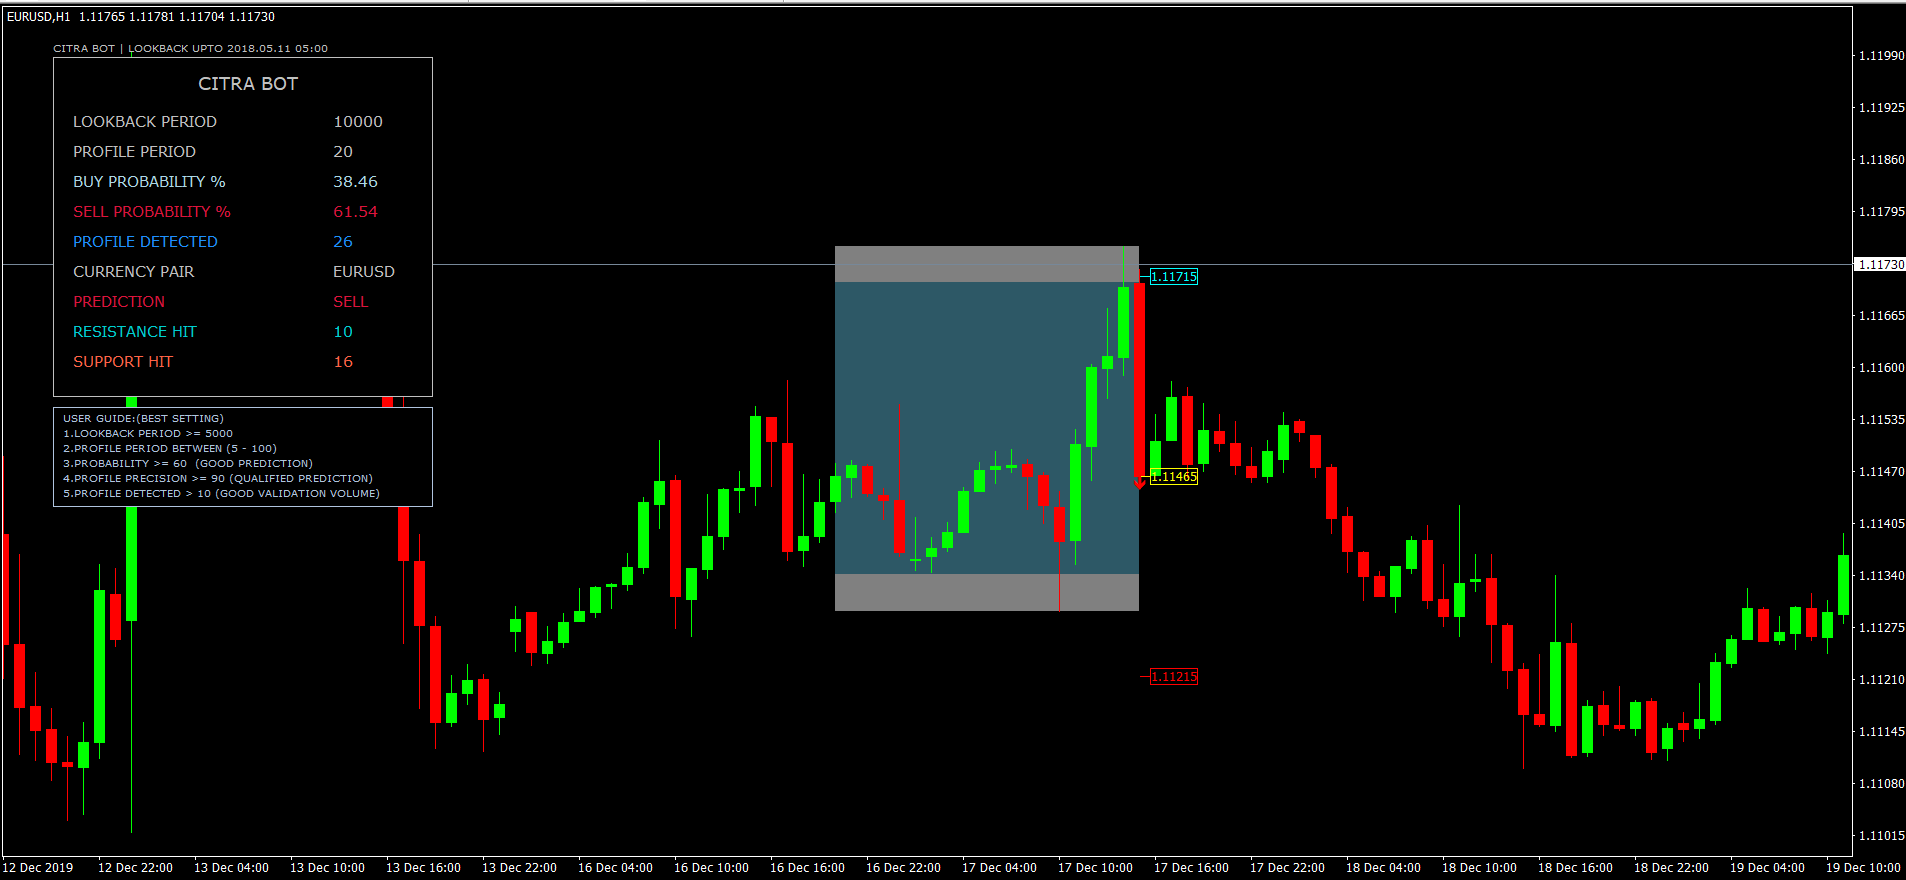
CITRA BOT is a Price Action/Price Pattern detection Indicator which uses historical data to validate a current pattern or profile to predict the probability of hitting future resistance or support levels.
MT4 Available Here - https://www.mql5.com/en/market/product/44857
MT5 Available Here - https://www.mql5.com/en/market/product/44859
Advantage of using CITRA BOT:
*Faster and Superior than any other Machine Learning Models like Neural Networks,Regressions,SVM,Decision tree,Random Forest etc.
*Faster response rate on switching TimeFrame.
*Precision based Profile detection Controls Noise allocation based on user requirements
*Custom Precision Percentage.
*Custom Email,Push Notification Alerts.
Dashboard Display:

Buy Signal:

Sell Signal:
Major features considered in Profile detection are
*Strength of the profile with respect to adjacent close price
*Profile dimension
*Future Resistance and Support
*Tops and Bottoms with respect to time
*Slope of profile
*Standard Deviation of profile
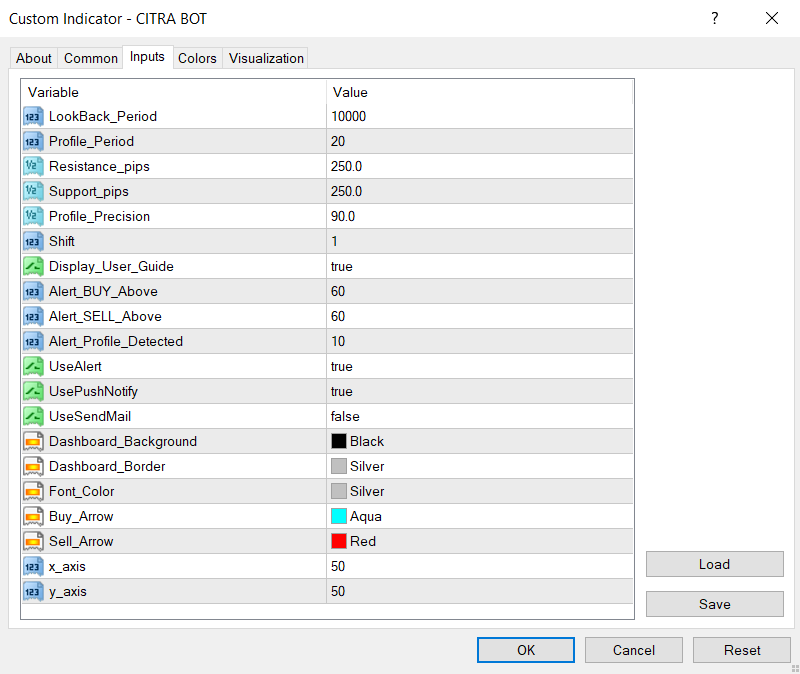
Details on Important Input Parameters:
*LookBack_Period = No. of Bars to look in historical memory for exact Profile.
Note:Download Required Historical Data as per LookBack Period.
*Profile_Period = No. of recent Bars to consider for a Profile.
*Resistance_pips= pips to set future Resistance level from current Close Price.
*Support_pips= pips to set future Support level from current Close Price.
*Profile_Precision= % of exact Match Detecting Precision.
*Alert_BUY_Above=It’s the Buy Probability alert percentage.
*Alert_SELL_Above=It’s the Sell Probability alert percentage.
*Alert_Profile_Detected=Alert on exceeding No. Of profile detected.
*x_axis,y_axis = Positioning of Display Dashboard on Chart.
Probability Calculation:
Buy Probability = ( Resistance Hit / (Resistance Hit + Support Hit) ) *100.
Sell Probability = ( Support Hit / (Resistance Hit + Support Hit) ) *100.
Trade Setup:
Buy = Up Arrow Popup -Set TP at Resistance Level , SL at Support Level.
Sell = Downl Arrow Popup -Set TP at Support Level , SL at Resistance Level.
Explainer Video:
Thank you.


