"Do You Remember… The Future?"
Do you want to know the future? No matter if the question is about the market in general, or a single ticker tendency, I'm sure all traders do want to know it. Successful trading is impossible without a price prediction of some kind or another. So everyone uses a method - intuition, technical analysis, fundamental analysis, or something else - to look into the future. Today I'm starting a series of blog-posts featuring special tools for the future prediction. And the first post is about
PriceProbability and
PriceProbabilities indicators.
Before we delve into details, let us consider a nature of prediction. According to Wikipedia, "a prediction is a statement about the way things will happen in the future, often based on experience or knowledge". The experience or knowledge can be formed only on some facts existing in the past. And more facts we know from the past the larger is our experience. When the number of facts grows it's useful to apply statistical calculations for extracting knowledge from raw data. And quotes are good example of a massive raw data, represented as time series. So how can we apply statistics here?
One of possible approaches is based on dependency between a price change and a period of time, during which the change happened.
Of course, as we talk about statistics, the dependency can be described as a matrix, where we accumulate and sum up all the facts, that is all price changes and corresponding time periods in the history.
For example, we can observe how often EURUSD price increases 100 points on a single H1 bar, how often this happens on 2 bars, 3 bars, and so on. Then we can gather the same statistics for 200 points increase, 300 points, and for any other values with preferred step.
Having such statistics one can perform reverse calculations at any moment. The algorithm could be something like that:
- get a distribution of possible increases on 1 bar, and add them to the previous bar opening price, then remember resulting price levels;
- get a distribution of possible increases on 2 bars, and add them to opening price of the bar before the previous bar, then remember these resulting price levels as well;
- repeat the same actions for N last bars, where N is selected large enough to comprise maximal gains handled by your preferred trading strategy or duration of trades;
- accumulate all resulting price levels probabilities and find their maximums - these are levels which the price will touch most likely.
Of course, price decrease is also possible and processed in the same way. In general, you'll get most probable price levels above and below current price. If you want a simple instruction whether to buy or to sell, just sum up probabilities at all the estimated levels up and down, and then compare them with each other. If upper levels totaled a value much larger than lower levels, then buy. If situation is just other way round, then sell. And if the sums differ not too much, then wait.
Even if you find all the stuff is a little bit complicated, nothing to worry about. This is how
PriceProbability and
PriceProbabilities indicators work, so everything is already done and ready for use.

PriceProbability gathers overall statistics for price changes and corresponding periods on available history, then calculates probabilities of future price levels for you, and compares upper and lower levels strengths. The result is a single number presenting combined strength of trading signal. It can be either to buy - if it's positive - or to sell - if it's negative. In both cases the signal ranges from 0 to 100, and values near 0 suggest waiting outside the market, no matter if they are above zero or below.
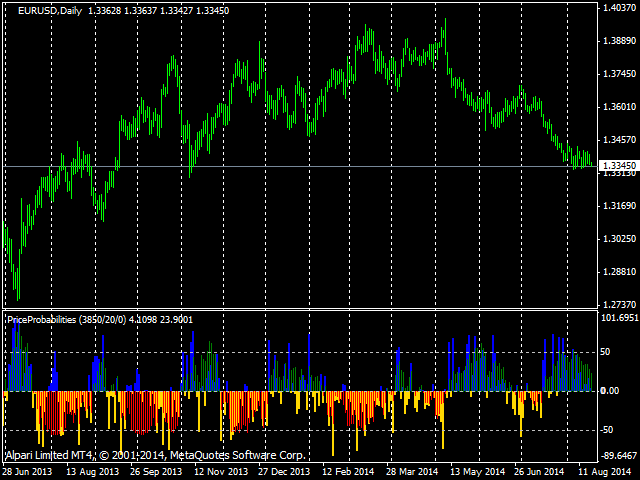
While PriceProbability provides a signal for current - latest - bar, and intended for manual trading, PriceProbabilities performs the same calculations on specified number of last bars and displays signals evolution in a separate window. It allows you to analyse dynamics of the signals in the past and use them for automatic trading in an expert adviser.
Now it's probably the time to ask the final question: how do we know that statistics on the history will produce accurate prediction of the future? This is how statistics work. They extract general rules from a big data, for a long time, and this is why the rules can not change fast. So you can take it for granted that statistical prediction will match the future in statistical sense.
To be continued...
(Part II, Part III, Part IV)


