26 Februari 2016 9:53 AM
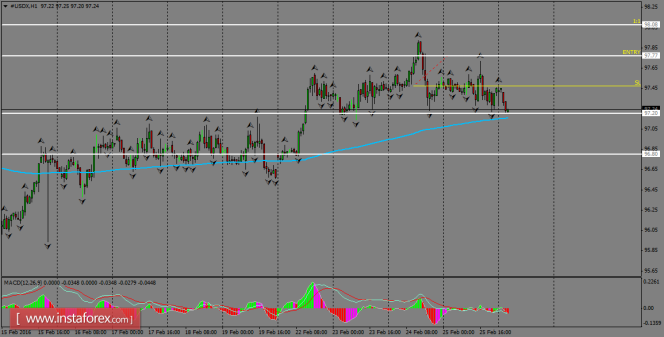
The USDX is finding dynamic support above the 200 SMA and trying to extend the rebound until the resistance level of 97.77. When the index achieves in breaking the support level of 97.20, then we can expect a decline towards the level of 96.80, which would be the start of a bearish trend on a short-term basis. The MACD indicator is still trading in the negative territory.

H1 chart's resistance levels: 97.77 / 98.08
H1 chart's support levels: 97.20 / 96.80
Trading recommendations for today: Based on the H1 chart, place buy (long) orders only if the US dollar index breaks with a bullish candlestick; the resistance level is seen at 97.77, take profit is at 98.08, and stop loss is at 97.47.
The material has been provided by InstaForex Company - www.instaforex.com


