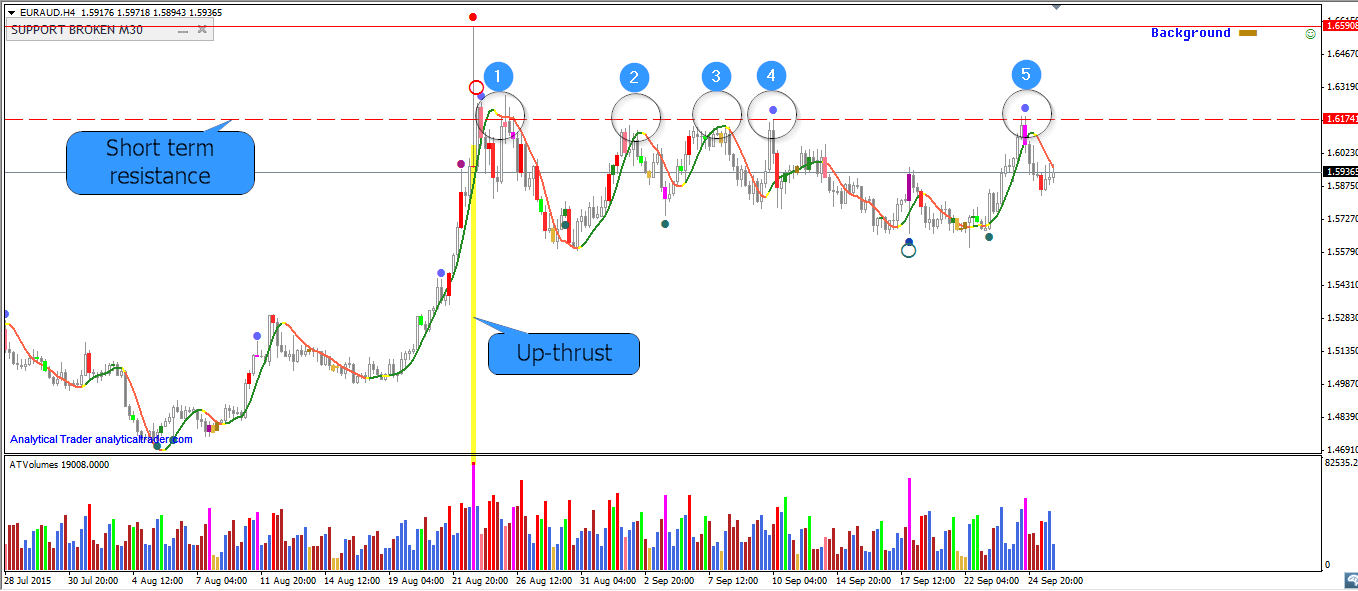
In this chart you can see how short term resistance 5 times showed itself as a resistance to higher prices. The more often the resistance shows itself, the stronger it becomes. Because each time retail traders will set their sell-limit or market orders when the price will come closer to the resistance level. If professionals want higher prices they will have to absorb this selling. Therefore volume will be high. Volume Spread Analysis can help us to understand whether the resistance will be broken this time (in Analytical Trader it is red bars, presence of strong signals before a move takes place and absence of weak signals). Before the resistance established itself for the first time, we see an up-thrust.
Up-thrust is a wide spread up during the bar, accompanied by high volume, to then close on the low. Up-thrusts are usually seen after a rise in the market, where the market has now become overbought and there is weakness in the background. Up-thrusts are all moneymaking maneuvers helping the market-makers to trade successfully, at your expense.
In points 2, 3 there are no weak signals, but it is wise to use multi-timeframe approach.

In below timeframe (H1) short term resistance is displayed as long term and each time when the price comes to this level Analytical Trader indicates weak signals (supply) right before down move.


