Oscillator - Histogram Indicator
Looking good 
Can you throw in the template as well ?
mart-hart:
Looking good
Can you throw in the template as well ?
Looking good
Can you throw in the template as well ?Hi mart-hart,
Completly the Template according your request.
Thank's for your response.
Best Regards,
Tsar
Great work, thanks for sharing, does it repaint at all?
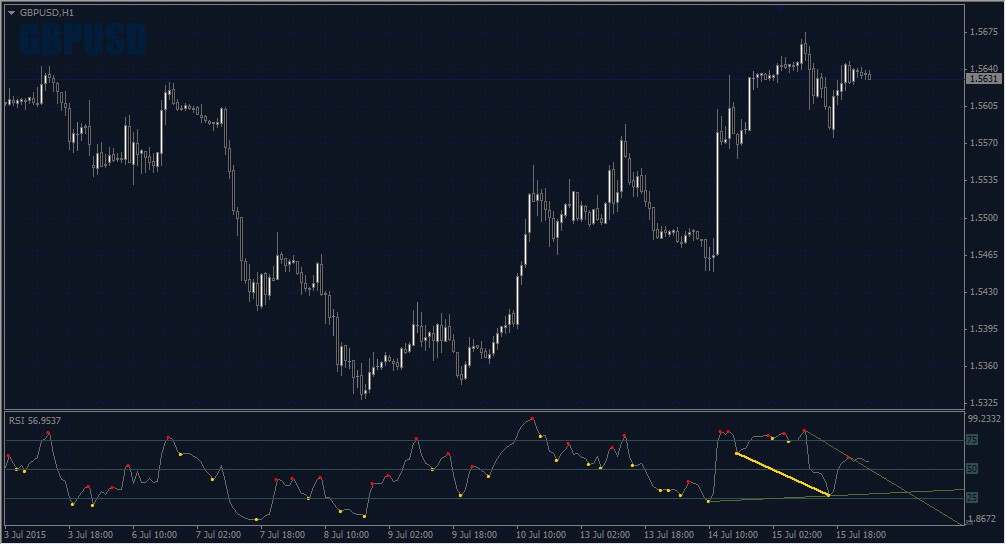
divergencepetr_s7
These Divergence petr updated & upgraded for MT4 nmc 
Description:
Indicator to trade Divergence.
To determine the divergence can select one of 30 oscillator.
Indicator:
- extreme peaks in the form of dots (red - the highs and yellow - a minimum);
- Divergence using segments connecting the extremes;
- support / resistance lines in the form of rays passing through the extremes;
- Channels in the form of rays.
- Accelerator
- Accumulation / Distribution
- Average Directional Movement Inde.
- Average True Range
- Awesome oscillator
- Bears Power
- Bulls Power
- Commodity Channel Index
- DeMarker
- Force Index
- Momentum
- Money Flow Index
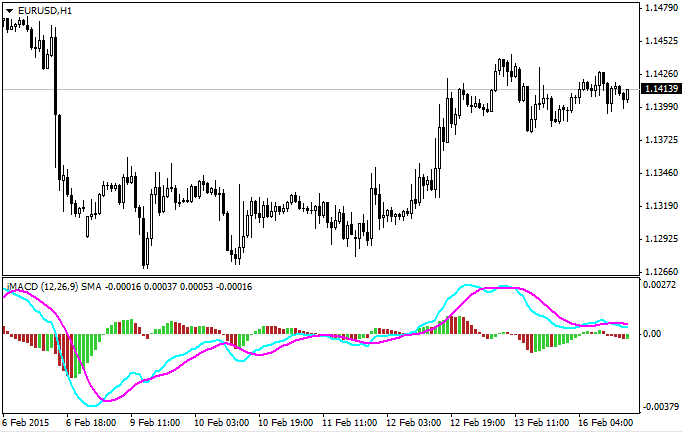
- Moving Averages Convergence / Divergence
- Moving Average of Oscillator
- On Balance Volume
- Relative Vigor Index
- Standard Deviation
- Stochastic Oscillato.
- Volume
- Close
- Open
- High
- Low
- (H + L) / 2
- (H + L + C) /.
- (H + L + C + C) / 4
- (O + C + H + L) / 4
- (O + C) / 2
- Relative Strength Index
- Larry Williams' Percent Range
- ... Relative Strength Index
- Osc = 29 - the number of the oscillator;
- TH = true - bearish divergence;
- TL = true - a bullish divergence;
- trend = true - support / resistance lines;
- convergen = true - hidden divergence;
- Complect = 1 - the distinguishing index of the indicator on the chart;
- BackSteph = 0 - number of steps backwards h;
- BackStepl = 0 - number of steps back l;
- BackStep = 0 - number of steps backward;
- qSteps = 1 - the number of displayed steps, not more than three;
- LevDPl = 5 - level points DeMark (2 = central bar will be above (below) the two bars on the left);
- LevDPr = 1 - level points DeMark (2 = central bar will be above (below) the two bars on the right);
- period = 8 - period for iADX, iATR, iBearsPower, iBullsPower, iCCI, iDeMarker, iForce, iMomentum, iMFI, iRVI, iStdDev, iRSI, iRSI, iWPR;
- ma_method = 0 - averaging method for iStochastic, iStdDev, iForce;
- ma_shift = 0 - the average for the shift iStdDev;
- applied_price = 4 - price type for iRSI, iRSI, iStdDev, iOBV, iOsMA, iMACD, iMomentum, iForce, iCCIiBullsPower, iBearsPower, iADX;
- mode = 0 - the index of the line for iStochastic, iRVI, iMACD, iADX;
- fast_ema_period = 12 - the average for the period of rapid iOsMA, iMACD;
- slow_ema_period = 26 - the period for slow average iOsMA, iMACD;
- signal_period = 9 - the period of the signal line to iOsMA, iMACD;
- Kperiod = 13 - K for the period of line iStochastic;
- Dperiod = 5 - D line for the period iStochastic;
- slowing = 3 - moderation iStochastic;
- price_field = 0 - the type of prices for iStochastic;
- showBars = 1000 - if = 0, the indicator is shown for the entire chart;
- Trend_Down = true - the line resistance;
- Trend_Up = true - line support;
- TrendLine = true - support / resistance lines;
- HandyColour = true;
- Highline = Red - the color channel HL;
- Lowline = DeepSkyBlue - color channel LL;
- ChannelLine = false - channels in parallel trend lines;
- Trend = 0 - 1 = only UpTrendLines, -1 = only DownTrendLines, 0 = all TrendLines;
- Channel = false - channels;
- Regression = true - channel linear regression, false - the standard deviation of the channel;
- RayH = true - beam channel High;
- RayL = true - beam channel Low;
- ChannelH = Red - the color channel High;
- ChannelL = DeepSkyBlue - color channel Low;
- STD_widthH = 1.0 - sets the size of the deviation for the object CHANNEL High;
- STD_widthL = 1.0 - sets the size of the deviation for the object CHANNEL Low;
- comment = false - Displays comments;
- code = 159 - Code for the Wingdings font symbol to denote the extrema;
- BuyStop = false - levels BuyStop;
- SellLimit = false - levels SellLimit;
- SellStop = false - levels SellStop;
- BuyLimit = false - levels BuyLimit.
- Color oscillator and extreme points of customizable tab Colors.
- When installing more than one indicator to the chart to change parameters Complect.
Choosing the right oscillator is held in the first line of entering the number of the oscillator - parameter Osc. By default, the indicator RSI (number 29).
Selecting oscillators:
The list of parameters to adjust:
Advice:
Files:
divergencepetr_s7.zip
183 kb
Nice but where is the oscillator of ma?
You are missing trading opportunities:
- Free trading apps
- Over 8,000 signals for copying
- Economic news for exploring financial markets
Registration
Log in
You agree to website policy and terms of use
If you do not have an account, please register
Trade Made Simple (TMS) Oscillator and Histogram Indicators
Cheers