

This is a guide for understanding the Fractal Cycles Indicator. In steps below I will try to explain its theory and practical use.
The Theory
Market is Fractal. It repeats itself.
Due to this Nature of the Price some Patterns are formed repeatedly in a Symbol. One such Pattern is a Clear Swing that connects consecutive Fractals that are advancing in one direction(Bearish or Bullish). I call this a "Fractal Cycle".
Lets see images for more clear understanding
A Fractal Cycle

Here we see how this Pattern is identified. Not just that Patterns can even occur within a Bigger Pattern thus explaining Market Fractality
Smaller inside Bigger

The Usage
Now that we have seen how Fractality works, lets see an example of usage
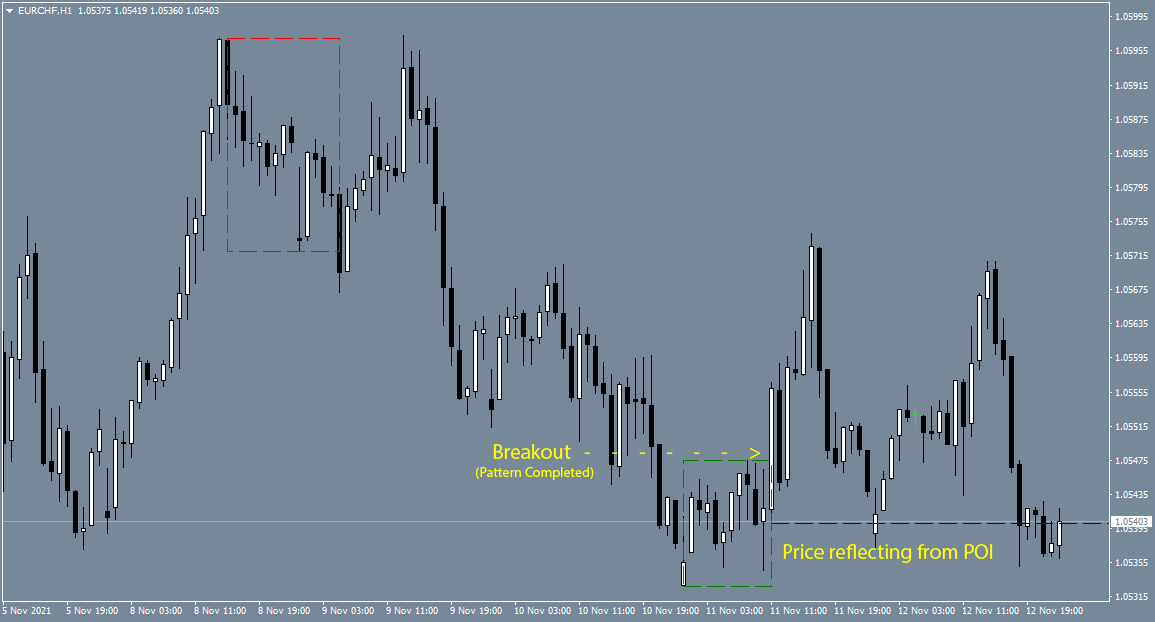
The indicator Alerts on the completion of the Cycle as well as when the Price comes back to the POI(Point of Interest). A specific parameter in the indicator allows user to check not only last Cycle POI but also when Price reaches the mid of any of the previous Cycles.
The Conclusion
Add this tool in you Market Analysis and take advantage of the Fractal Component in identifying Breakouts, Impulsive moves & Potential Reaction Levels


