

---------------- TREND SYSTEM ----------------
Trend Screener Indicator

Trend Line Map Indicator
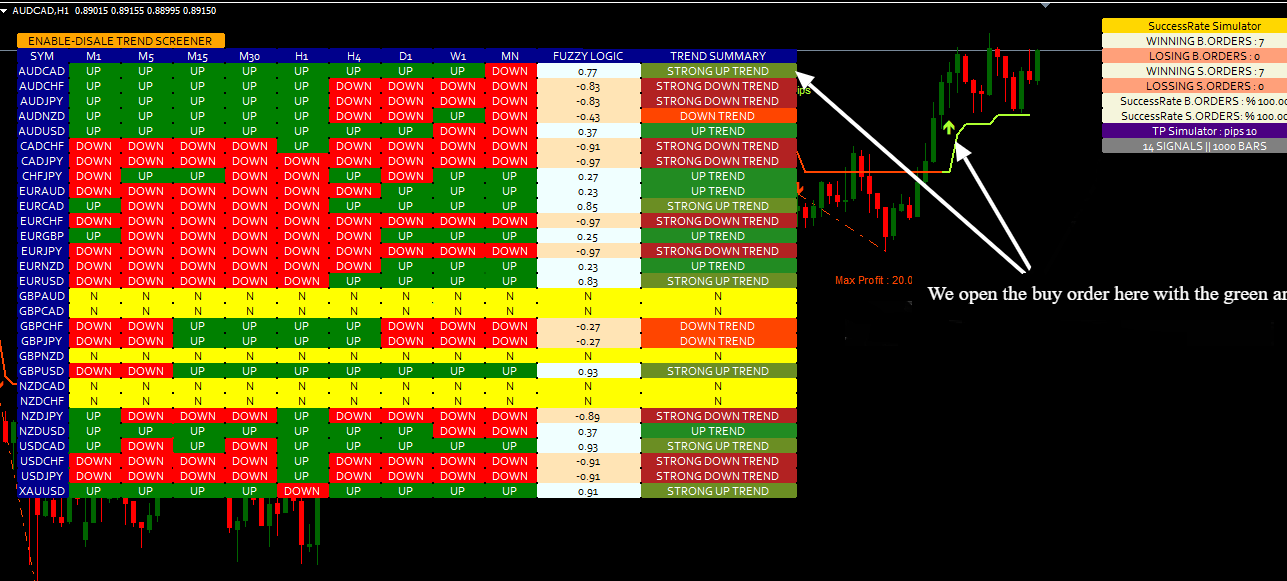
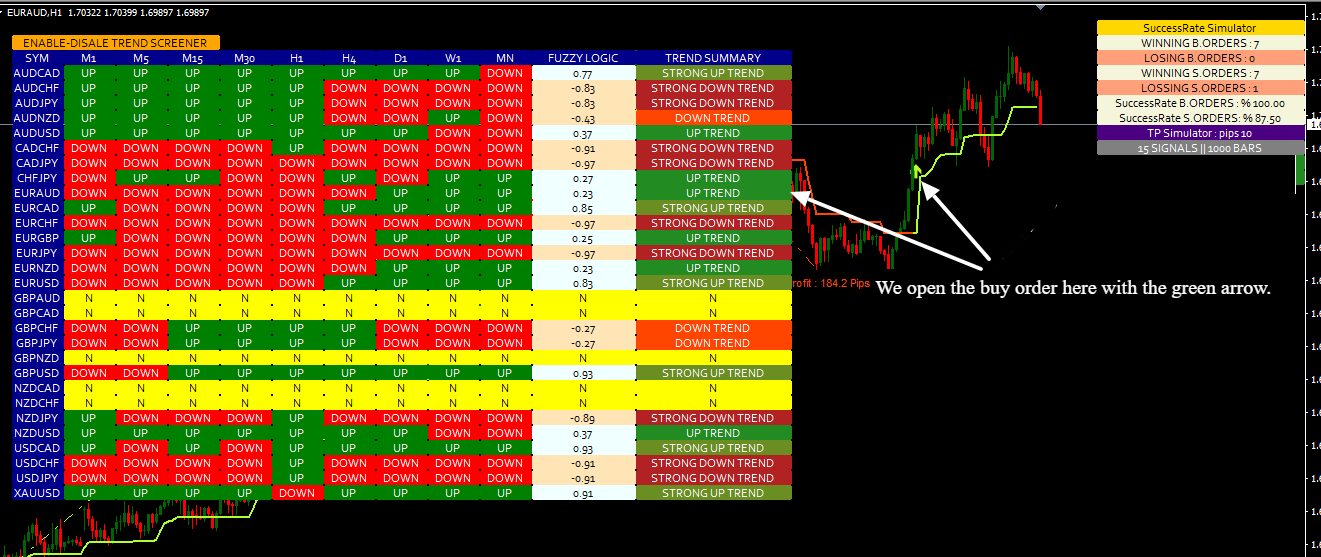
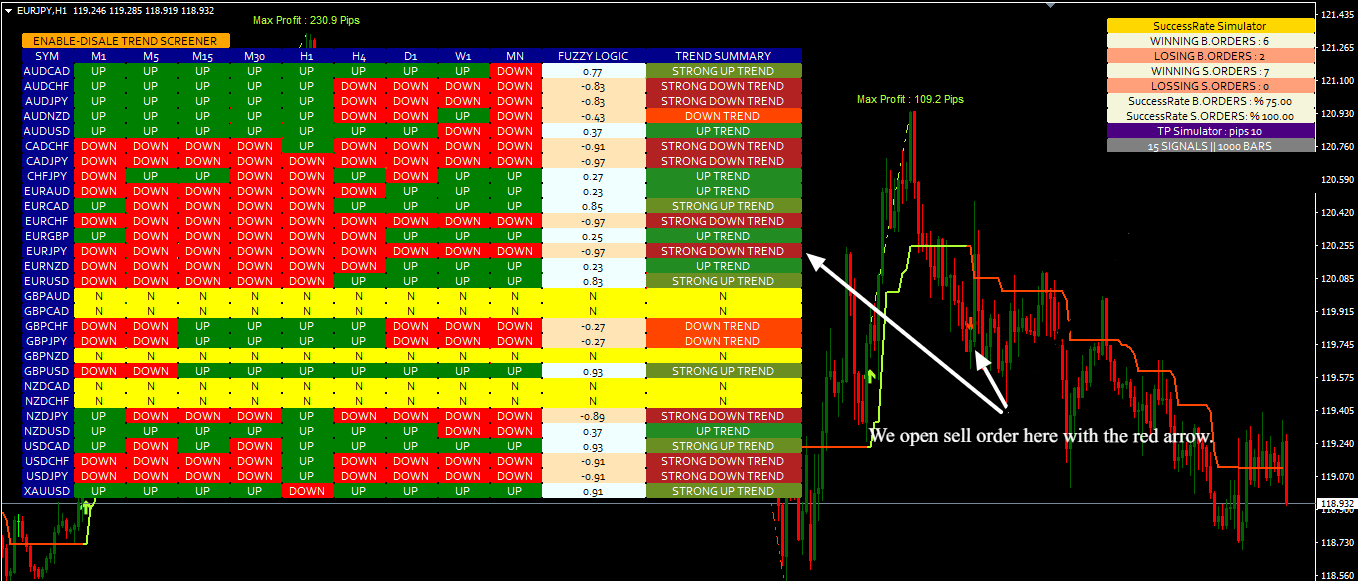
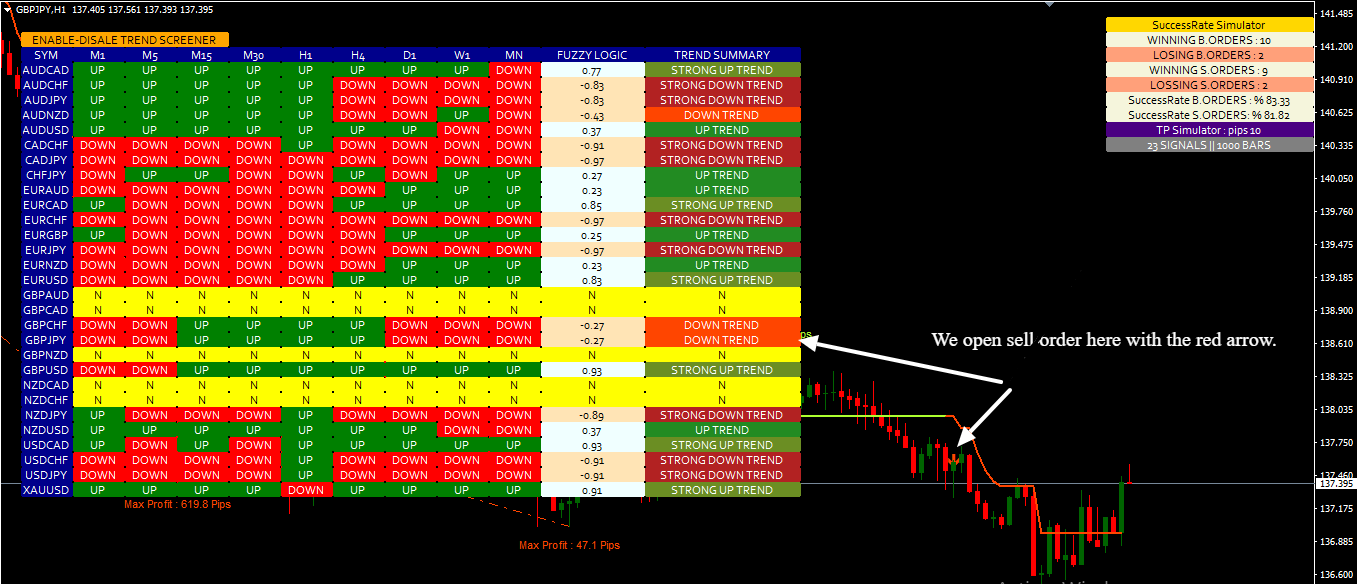
Trend Screener Dashboard will display 5 Status per currency pair :
- Status : STRONG DOWN TREND
- Status : STRONG UPTREND
- Status : DOWN TREND
- Status : UPTREND
- Status : NEUTRAL
Example :
Currency pair STATUS Recommendation EURUSD STRONG DOWN TREND EURUSD is very bearish and it's the perfect time to make sell trade. GBPUSD DOWN TREND STATUS GBPUSD has a confirmed downtrend and its perfect to make sell trade. ( Begin of a new trend ) USDCAD STRONG UP TREND USDCAD is very bullish and its the perfect time to make buy trade. EURJPY NEUTRAL Avoid trading in EURJPY. NZDUSD UP TREND NZDUSD has a confirmed uptrend and its perfect time to make buy trade. ( Begin of a new trend )
------------------------- TRADING METHOD 1 -------------------------
1.1 BUY ENTRY RULER
RULE 1:
Change of Trend line from Sell to Buy and Status of Trend is STRONG UPTREND.
OR
Rule 2:
Change of Trend line from sell to buy and Status of Trend in UPTREND.
Or
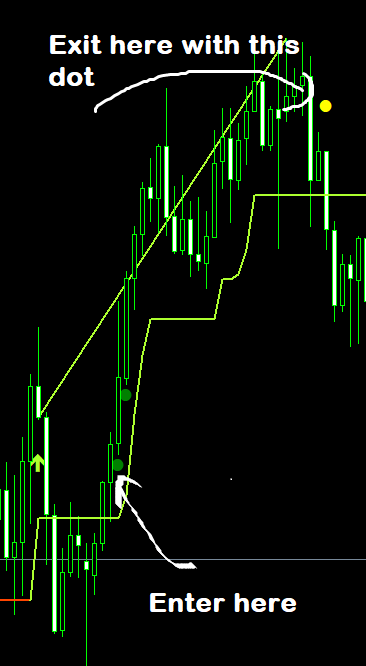
Entry points when the Green Dot Appears. Green Dots it means Strong Up TrendRule 3 :
1.2 SELL ENTRY RULES
Rule 1:
Change of Trend line from Buy to SELL and Status of Trend is STRONG DOWN TREND.
OR
Rule 2:
Change of Trend line from BUY to SELL and Status of Trend in DOWN TREND.
OR
Rule 3 :
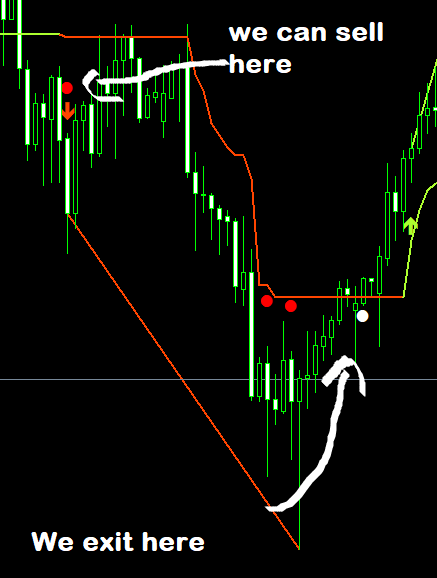
Entry points when the Red Dots Appears. Red Dots means Strong Down Trend.
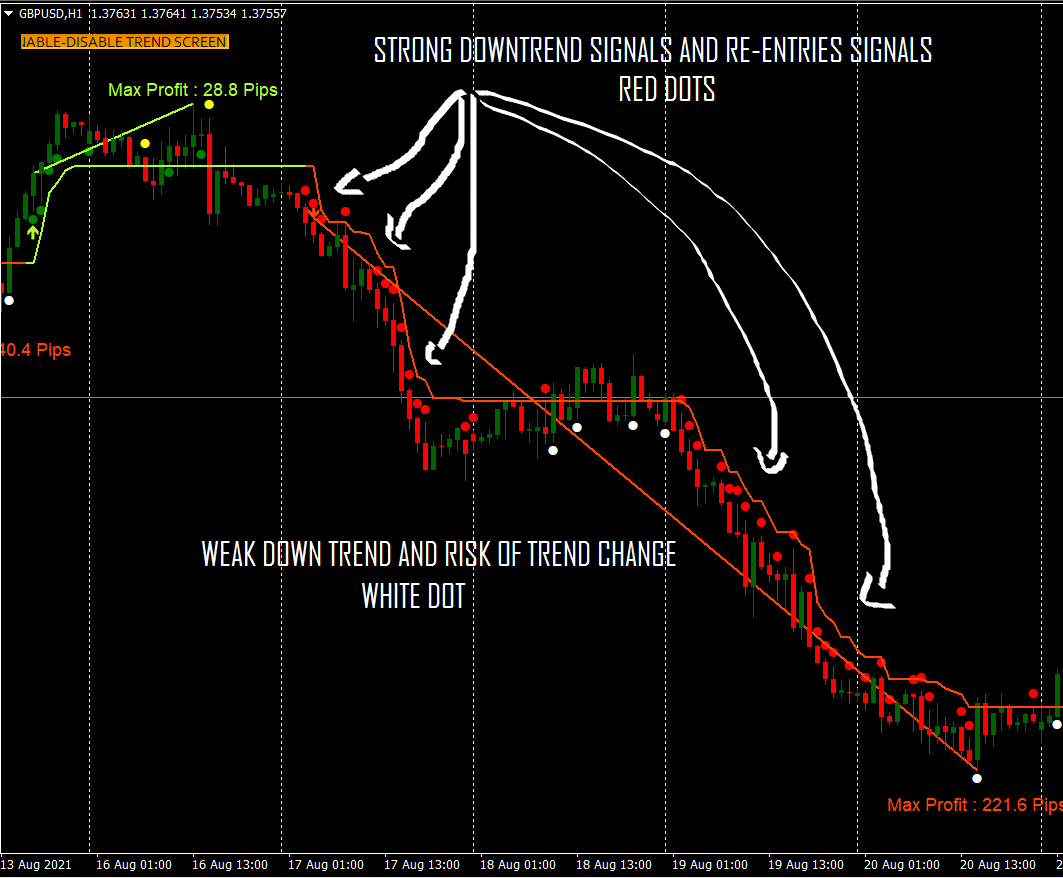
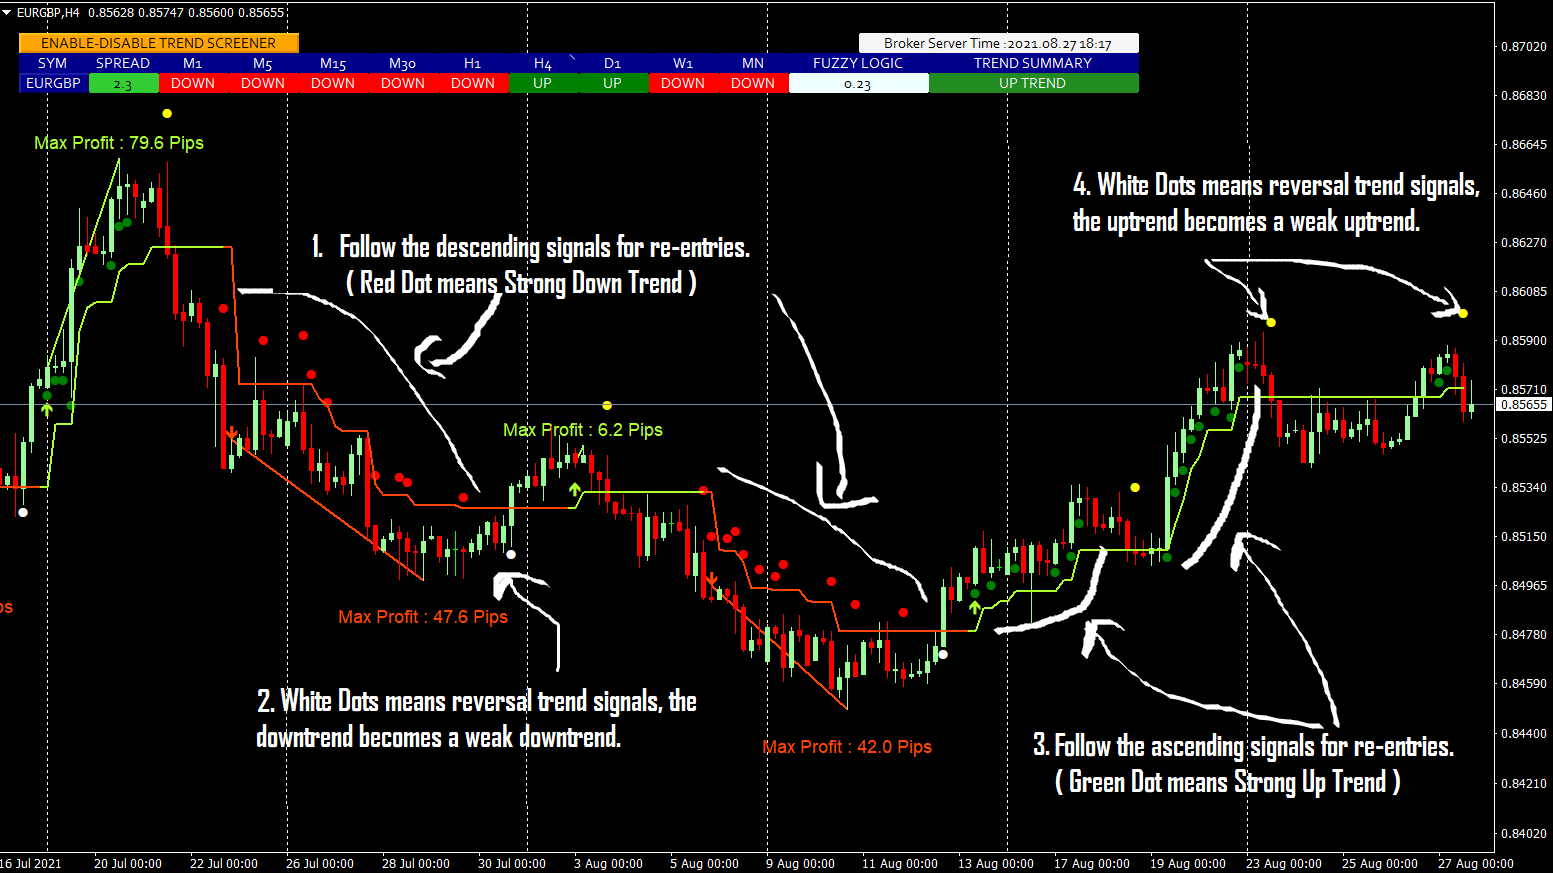
Trend Signals ( Strong Trend Signals and Trend Reversal signals )
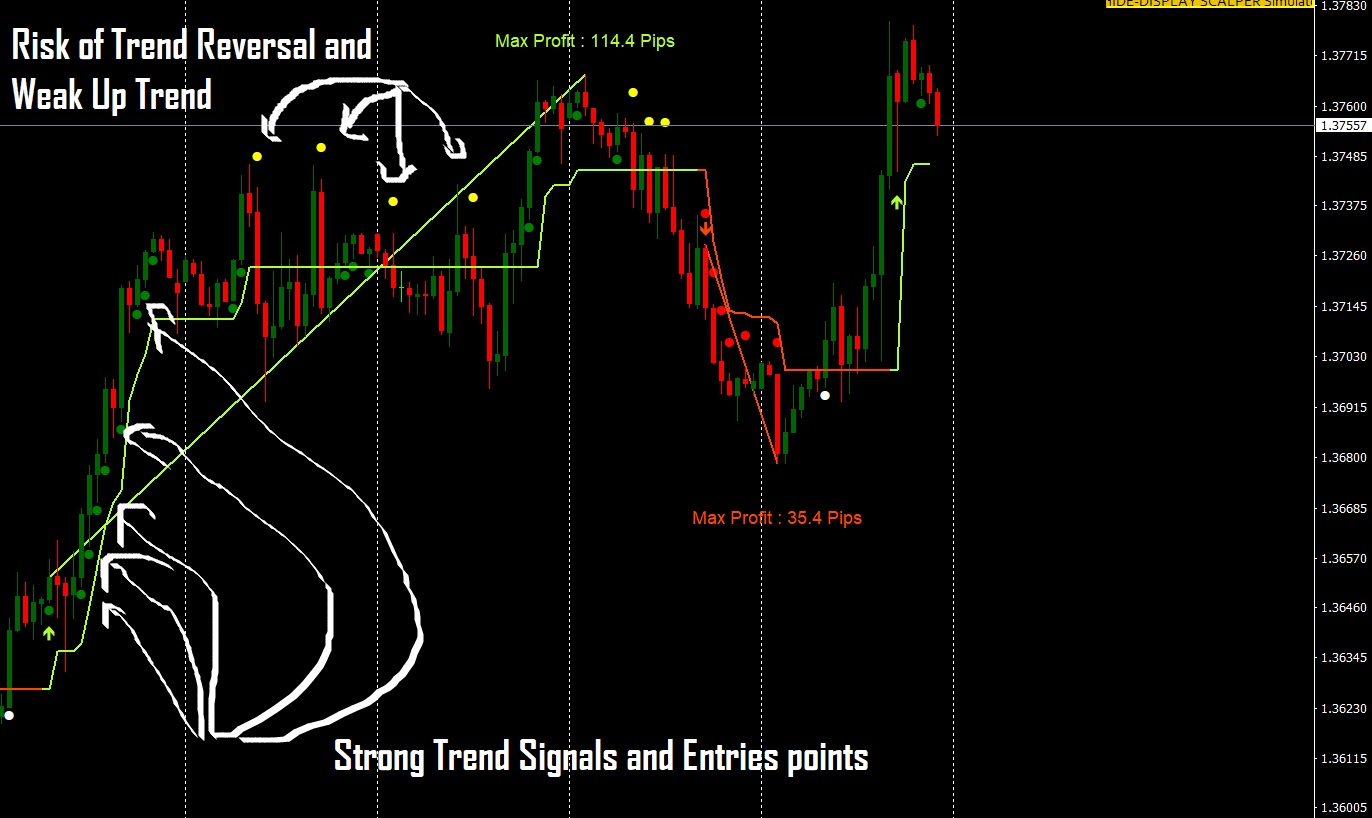
The Trend Screener indicator will draw Dots signals in the charts where :
- Green Dots: Strong UpTrend Signals ( areas ) and the possibility of buy re-entries.
- Red Dots: Strong DownTrend Signals ( areas ) and the possibility of sell re-entries.
- White Dots: Trend Reversal Signals ( areas ) or Weak downtrend and risk of the trend change to Uptrend.
- Yellow Dots: Trend Reversal Signals ( areas ) or weak uptrend and risk of the trend change to downtrend.
Important Note :
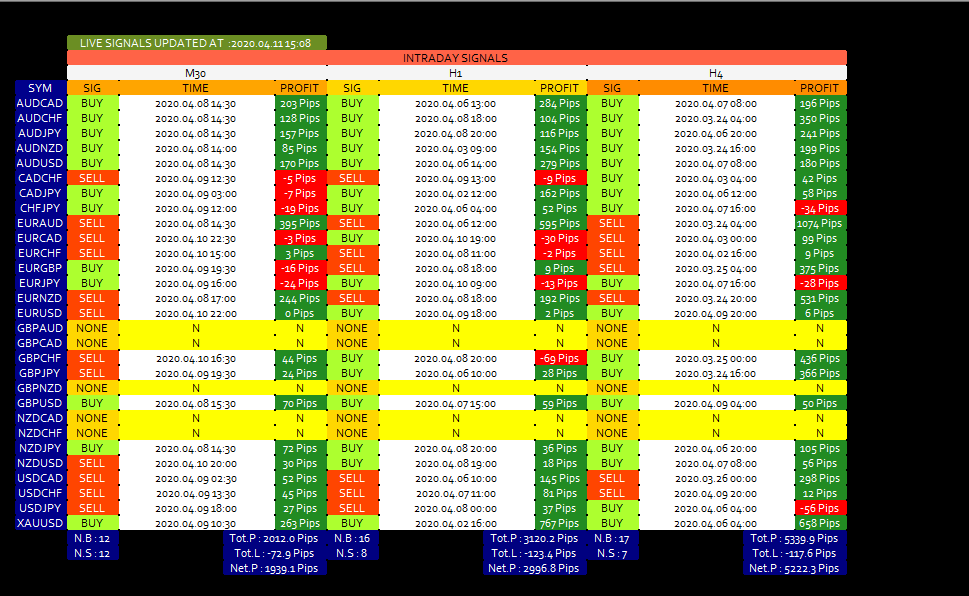
Trend Line Map Indicator used as a module for Trend Screneer Indicator to
- Display all active buy, sell signals.
- Getting alert when a new buy and sell signals are confirmed.
- Display the live profit/Loss in Pips for all active signals.
- Display the time of generating all active trading signals.
------------------------- TRADING METHOD 2 -------------------------
Trend Screener is working as a filter :
2.1 When you see a STRONG UP TREND or UP TREND in a currency, you should avoid opening a Sell position in this currency.
2.2 When you see a STRONG DOWN TREND or DOWN TREND in a currency, you should avoid opening Buy positionin this currency.
------------------------- TRADING METHOD 3 -------------------------
Trend Currency Strength is working as a filter :
Please check this article, https://www.mql5.com/en/blogs/post/734338
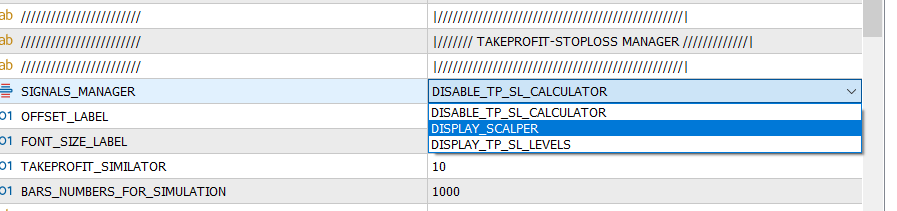
-------------- How to find Take Profit for signals? ------------
Trend TakeProfit :
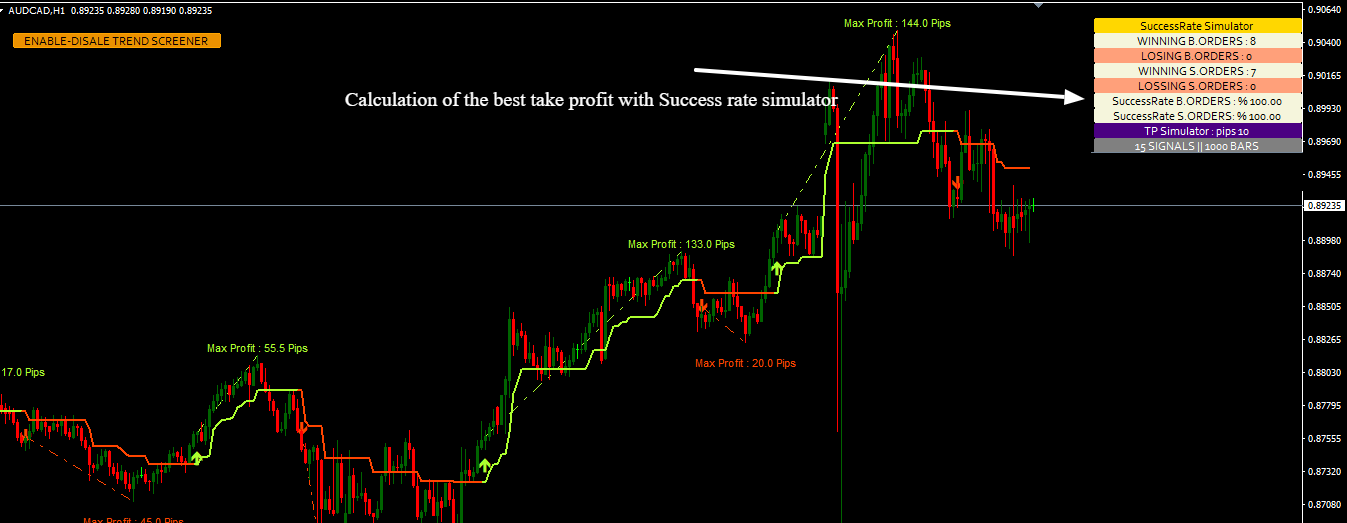
Takeprofit Method 1: Scalper simulator
You can use this method to find the best take profit based on timeframe/pair and then using this TP during trading. With the akeprofit simulator,you can test several takeprofit and use the highest one with success rates.
How to reach a trading signals with success rate more than 80% with SUCCESS RATE SIMULATOR ?
please visit ► https://www.mql5.com/en/blogs/post/733976
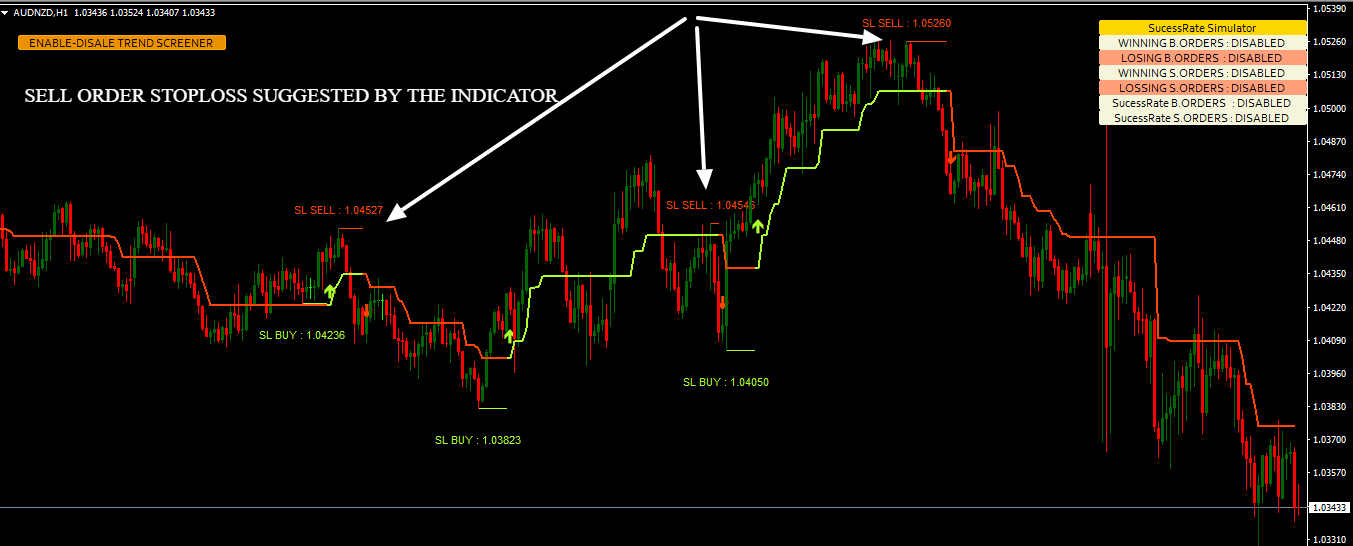
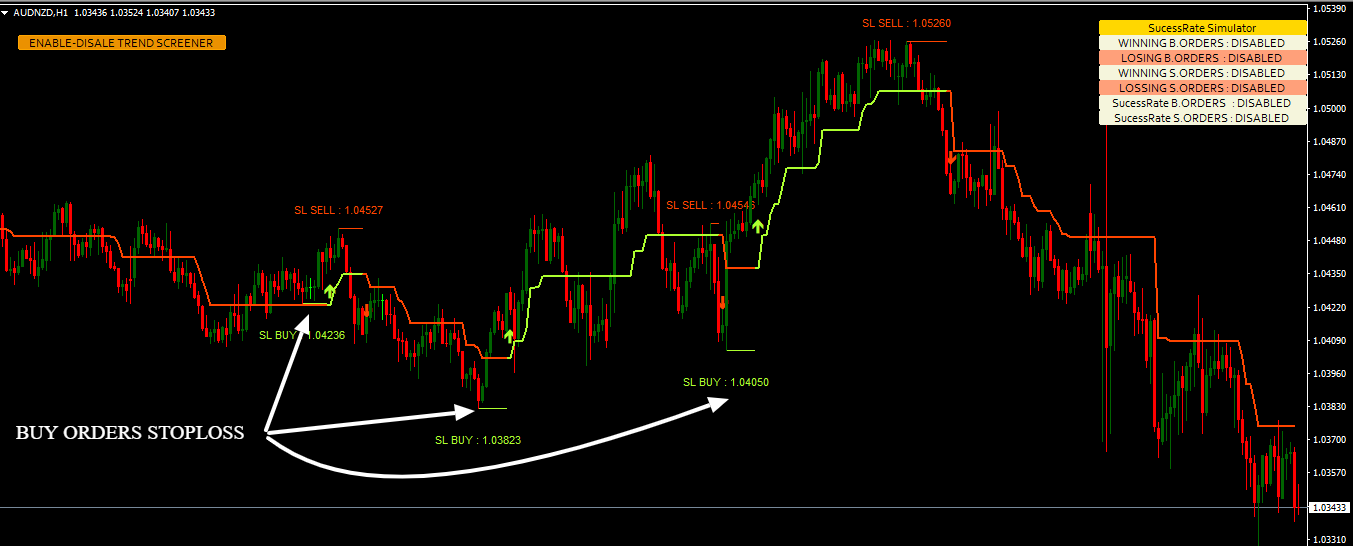
-------------- How to find StopLoss for signals? ------------
To find the best Stoploss, you need RUN_SL_CALCULATORand the indicator will display in the chart the recommended Stoploss per signal.
SELL ORDERS STOPLOSS
BUY ORDERS STOPLOSS
This Stoploss level used with both Takeprofit based ATR or Takeprofit based Scalper simulator.
Takeprofit Method 2: Based on Reversal Dots.
Buy Case : When we have Buy trade and we identify a reversal Dot, we need to close the trade.
Sell Case : When we have Sell trade and we identify a reversal Dot, we need to close the trade.
How Trend Line Map indicator working with Trend Screener indicator ?
Step 1 : Open Chart 1 and attach Trend Screener indicator in Chart 1.Step 2 : Open Chart 2 and attach Trend Map Line indicator in chart 2.
Buy Signal: TREND LINE BUY SIGNAL + the TREND SUMMARY ( UP-TREND or STRONG-UP-TREND)
Sell Signal: TREND LINE SELL SIGNAL + the TREND SUMMARY ( DOWN-TREND or STRONG-DOWN-TREND)
Feel free to post your comments below, thank you.
Author
SAYADI ACHREF , fintech software engineer and founder of Finansya.


