
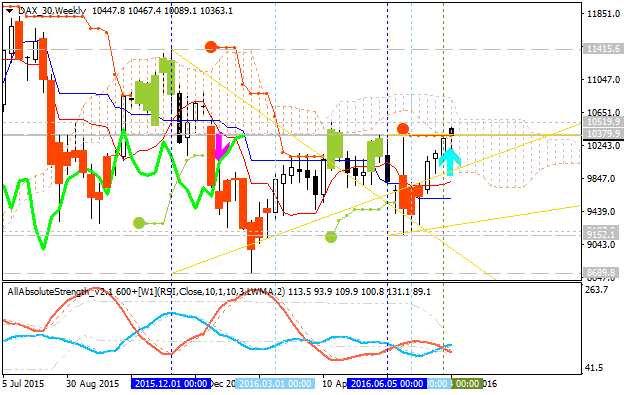
Dax Index Technical Analysis 2016, 07.08 - 14.08: daily bullish within narrow levels; weekly bullish reversal
6 August 2016, 15:26

6
238
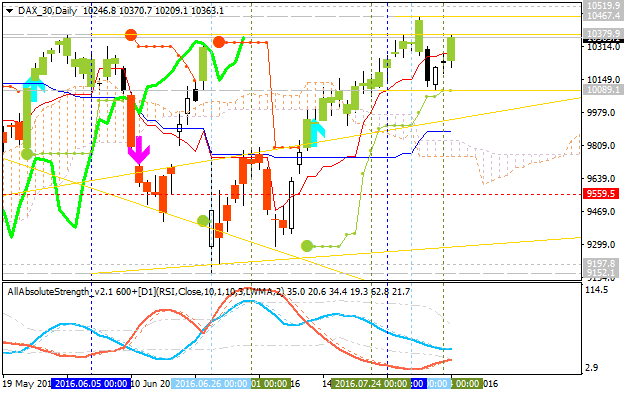
Daily price is located above Ichimoku cloud in the bullish area of the chart for the ranging within key narrow support/resistance levels:
- 10,467.4 resistance level located above Ichimoku cloud in the bullish area of the chart, and
- 10,089.1 support level located above Ichimoku cloud in the beginning of the secondary correction to be started.
Absolute Strength indicator is evaluating the ranging condition to be continuing.
If D1 price breaks 10,467.4 resistance level on close bar from below to above so the bullish trend will be continuing.
If not so the price will be on bullish ranging within the levels.
| Resistance | Support |
|---|---|
| 10,467.4 | 10,089.1 |
| N/A | 9,559.5 |
SUMMARY : ranging bullish


