无需 Python 或 R 语言知识的 Yandex CatBoost 机器学习算法
Aleksey Vyazmikin | 18 二月, 2021
前言
本文探讨了如何使用 Yandex 的 CatBoost 机器学习算法,在有限变量集和行为模式假设下建立描述市场模式的模型。您不需要 Python 或 R 语言知识就能够获得模型。此外,基本的MQL5知识已经足够了- 这正是我的水平。因此,我希望这篇文章能为广大读者提供一个很好的指导,帮助那些对评估机器学习能力感兴趣的人,并在他们的课程中实现这些能力。这篇文章提供的学术知识很少,如果您需要更多信息,请阅读 Vladimir Perervenko 的系列文章。
交易中经典方法与机器学习的区别
交易策略的概念可能是每个交易者都熟悉的。此外,对于那些有幸使用 MetaQuotes 产品的人来说,交易自动化是一个重要方面。如果我们在代码中去除交易环境,大多数策略主要意味着选择不均衡(通常在价格和图表上的指标之间)或使用指标值及其范围来做出入场(头寸打开)和退出决策。
几乎每个交易策略开发人员都有过深刻的见解,这导致了更多的交易条件和新的不均衡。每一次这样的增加都会在一定的时间间隔内引起财务结果的变化。但另一个时间间隔、时间框架或交易工具可能会显示出令人失望的结果——交易系统不再有效,交易者必须寻找新的模式和条件。此外,每一个新条件的加入都会减少交易次数。
在搜索过程之后,通常会对用于做出交易决策的不均衡进行优化。优化过程检查许多参数,这些参数通常超出初始数据值。另一种情况是,参数优化产生的不均衡价值很少出现,即使它们可以改善余额曲线或任何其他可优化参数,也可以将其视为统计偏差,而不是已发现的模式。因此,优化会导致在交易策略中实现的启发式思想与可用的市场数据过度拟合。如果策略意味着使用大量的变量和它们的值,那么这种方法在搜索最优解所花费的计算资源方面是效率很低的。
机器学习方法通过生成不均衡规则,只检查分析数据中存在的参数值,加快了参数优化和模式搜索过程。不同的模型创建方法使用不同的方法。然而,通常的想法是通过可用于训练的数据来限制解决方案搜索。机器学习并没有产生导致交易决策逻辑的不均衡,而是只提供包含价格信息和影响价格形成因素的变量值。这些数据被称为特征(或预测因子)。
特征必须影响我们希望通过轮询获得的结果。结果通常表示为一个数值:它可以是分类的类号,也可以是回归的设定值。这样的结果就是目标变量。有些训练方法没有目标变量,例如聚类方法,但本文将不讨论它们。
所以,我们需要预测因子和目标变量。
预测因子
对于预测因子,可以使用时间、交易工具的OHLC价格及其派生数值,即各种指标。也可以使用其他预测因素,如经济指标、交易量、未平仓利率、订单簿模式、期权价格和其他影响市场的数据来源。我认为,除了当前时刻形成的信息外,模型还应该接收到描述导致当前时刻的运动的信息。严格地说,预测因子应该提供一定时期内价格变动的信息。
我确定的几类预测因子描述了:
- 显著水平可以是:
- 水平的(如交易日开盘价)
- 线性的(例如,回归通道)
- 断开的(通过非线性函数计算,例如移动平均值)
- 价格和水平位置:
- 在固定点数范围内
- 在固定百分比范围内:
- 相对于当日开盘价或水平
- 相对于波动水平
- 相对于不同时间框架的趋势段
- 描述价格波动(波动性)
- 有关事件时间的信息:
- 自重要事件开始(从当前柱形图或不同时段(如当天)开始)以来经过的柱数
- 自重要事件结束后经过的柱数(从当前条或不同时段开始,如一天)
- 自事件开始和结束以来经过的柱数,显示持续时间
- 当前时间,如小时数、星期几、十年或月数、其他
- 有关事件动态的信息:
- 重要水平交叉的数量(包括考虑衰减/重复频率的计算)
- 第一次/最后一次事件发生时的最高/最低价格(相对价格)
- 事件速度(单位时间的点数)
- 将OHLC数据转换为其他坐标平面
- 振荡器类型指标的值。
对于预测因子,我们可以从不同的时间框架和交易工具中获取与将用于交易的工具相关的信息。当然,有更多可能的方法来提供信息。唯一的建议是提供足够的数据来再现交易工具的主要价格动态。一旦准备好了预测因子,您就可以进一步将它们用于各种用途。这大大简化了根据基本交易策略条件搜索模型的过程。
目标
在本文中,我们将使用一个二进制分类目标,即 0 和 1。这个选择源于一个限制,这将在后面讨论。那么,0和1能代表什么呢?我有两个方法:
- 第一种方法: "1" — 开启一个仓位 (或者执行另一项行为) 以及 "0" — 不开启仓位 (或者不执行行为);
- 第二种方法: "1" — 开启一个买入仓位 (第一个行为) 以及 "0" — 开启一个卖出仓位 (第二个行为).
为了生成目标变量信号,我们可以使用简单的基本策略,前提是生成足够数量的用于机器学习的信号:
- 当买入或卖出价格水平交叉时开仓(任何指标都可以作为一个水平);
- 根据价格相对于当日开盘价的位置,从一小时开始在第 N 个柱上开仓或忽略开仓。
试着找到一个基本的策略,使生成的0和1的数量大致相同,因为这将有助于更好的学习。
机器学习软件
我们将使用 CatBoost 软件进行机器学习,可在这个链接下载。本文旨在创建一个独立的版本,它不需要其他编程语言,而您只需要下载最新版本的exe文件,例如catboost-0.24.1.exe。
CatBoost是一个开源的机器学习算法,来自著名的Yandex公司。因此,我们可以期待相关的产品支持、改进和错误修复。
您可以在此处通过Yandex查看演示文稿(启用英文字幕,因为演示文稿是俄文的)。
简言之,CatBoost构建了一个决策树集合,使得每个后续树改进了所有先前树的总概率响应值。这叫做梯度提升。
为机器学习准备数据
包含预测因子和目标变量的数据称为样本。它是一个数据数组,包含作为列的预测因子的枚举,其中每一行都是一个度量时刻,显示该时刻预测因子值。记录在字符串中的测量值可以在特定的时间间隔获得,或者可以表示各种对象,例如图像。文件通常采用CSV格式,它对列值和标题(可选)使用条件分隔符 。
让我们在示例中使用以下预测因子:
- 时间/小时数/小时分数/一周中的某一天
- 柱的相对位置
- 振荡指标
目标变量是MA交叉点处的信号,在下一个柱处保持不变。如果价格高于MA,那就买。如果价格低于MA,则卖出。每次信号到达时,应关闭现有仓位。目标变量将显示是否打开一个仓位。
我不建议使用脚本来生成目标和预测变量。使用专家顾问,这将允许在生成样本时检测代码中的逻辑错误,以及数据到达的详细模拟-这将类似于实际交易中数据的到达方式。此外,如果目标变量使用不同的交易品种,您将能够考虑不同交易工具的不同开启时间,并考虑数据接收和处理的延迟,以防止算法看到未来,使用不适合训练的指标重绘和逻辑。结果表明,该模型在实际应用中,可以在柱上实时计算预测因子。
一些算法交易者,特别是那些使用机器学习的交易者表示,标准指标大多是无用的,因为它们是滞后的,是从价格中衍生出来的,这意味着它们不提供任何新的信息,而神经网络可以创建任何指标。的确,神经网络的功能是很强大的,但它们往往需要的计算能力,这是大多数普通交易者所无法获得的。此外,学习这种神经网络需要时间。基于决策树的机器学习方法在创建新的数学实体方面无法与神经网络竞争,因为它们不转换输入数据。但是当需要识别直接依赖关系时,它们被认为比神经网络更有效,特别是在大型和异构的数据数组中。实际上,神经网络的目的是产生新的模式,即描述市场的参数。基于决策树的模型旨在识别这些模式集合中的模式。通过使用终端的标准指标作为预测指标,我们采用了不同国家不同交易所和场外交易市场的数千名交易员使用的模式。因此,我们可以假设,我们将能够确定交易员行为对指标值的相反依赖性,这最终会影响交易工具。我以前没有用过振荡指标,所以看到结果会很有趣。
将使用标准终端自带的以下指标:
- Accelerator Oscillator(加速计振荡器)
- Average Directional Movement Index (平均方向性走势指标)
- Average Directional Movement Index by Welles Wilder (Wilder 平均方向性走势指标)
- Average True Rang (平均真实范围)e
- Bears Power (空头力度)
- Bulls Power (多头力度)
- Commodity Channel Index (商品通道指数)
- Chaikin Oscillator (Chaikin 振荡器)
- DeMarker
- Force Index (强力指数)
- Gator (鳄鱼)
- Market Facilitation Index (市场促进指数)
- Momentum (动量)
- Money Flow Index (资金流量指数)
- Moving Average of Oscillator (移动平均震荡指标)
- Moving Averages Convergence/Divergence (MACD)
- Relative Strength Index (相对强度指数)
- Relative Vigor Index (相对动量指数)
- Standard Deviation (标准方差)
- Stochastic Oscillator (随机振荡指标)
- Triple Exponential Moving Averages Oscillator (三倍指数移动平均线)
- Williams' Percent Range (威廉姆斯百分比范围)
- Variable Index Dynamic Average (可变指数动态均线)
- Volume (交易量)
指标是针对 MetaTrader 5 中提供的所有时间框架计算的,直至每日时间框架。
在撰写本文时,我发现以下指标的值在很大程度上取决于终端中的测试开始日期,这就是我决定排除它们的原因。对于这些指标,可以使用不同柱上的值之间的差异,但这超出了本文的范围。
排除指标列表:
- Awesome Oscillator (动量震荡器)
- On Balance Volume (平衡成交量)
- Accumulation/Distribution (离散技术指标)
要使用CSV表,我们将使用奇妙的库CSV fast.mqh,作者:Aliaksandr Hryshyn。开发库功能:
- 创建表,从文件中读取表并将其保存到文件中。
- 根据单元格地址向任何表单元格读写信息。
- 表列可以存储不同的数据类型,这样可以节省内存消耗。
- 表段可以完全从指定的地址复制到另一个表的指定地址。
- 提供按任何表列筛选。
- 根据列单元格中指定的值,提供降序和升序的多级排序。
- 允许重新索引列并隐藏它们。
- 还有更多其他有用且用户友好的特性。
EA 交易组件
基本策略:
我决定用一个条件简单的策略作为产生信号的基本策略。据此,如果符合下列条件就应当进入市场:
- 价格与价格的移动平均交叉。
- 条件1满足后,价格首次未触及前一个柱上的MA。
这是我的第一个策略,我在21世纪初制定的。这是属于趋势类的简单策略,它在适当的交易历史部分显示了良好的结果。让我们尝试使用机器学习来减少横盘区域中错误入场的数量。
信号生成器如下:
//+-----------------------------------------------------------------+
//| Returns a buy or Sell signal - basic strategy                   |
//+-----------------------------------------------------------------+
bool Signal()
{
// Reset position opening blocking flag
   SellPrIMA=false;  // Open a pending sell order
   BuyPrIMA=false;   // Open a pending buy order
   SellNow=false;    // Open a market sell order
   BuyNow=false;     // Open a market buy order
   bool Signal=false;// Function operation result
   int BarN=0;       // The number of bars on which MA is not touched
   if(iOpen(Symbol(),Signal_MA_TF,0)>MA_Signal(0) && iLow(Symbol(),Signal_MA_TF,1)>MA_Signal(1))
   {
      for(int i=2; i<100; i++)
      {
         if(iLow(Symbol(),Signal_MA_TF,i)>MA_Signal(i))break;// Signal has already been processed on this cycle
         if(iClose(Symbol(),Signal_MA_TF,i+1)<MA_Signal(i+1) && iClose(Symbol(),Signal_MA_TF,i)>=MA_Signal(i))
         {
            for(int x=i+1; x<100; x++)
            {
               if(iLow(Symbol(),Signal_MA_TF,x)>MA_Signal(x))break;// Signal has already been processed on this cycle
               if(iHigh(Symbol(),Signal_MA_TF,x)<MA_Signal(x))
               {
                  BarN=x;
                  BuyNow=true;
                  break;
               }
            }
         }
      }
   }
   if(iOpen(Symbol(),Signal_MA_TF,0)<MA_Signal(0) && iHigh(Symbol(),Signal_MA_TF,1)<MA_Signal(1))
   {
      for(int i=2; i<100; i++)
      {
         if(iHigh(Symbol(),Signal_MA_TF,i)<MA_Signal(i))break;// Signal has already been processed on this cycle
         if(iClose(Symbol(),Signal_MA_TF,i+1)>MA_Signal(i+1) && iClose(Symbol(),Signal_MA_TF,i)<=MA_Signal(i))
         {
            for(int x=i+1; x<100; x++)
            {
               if(iHigh(Symbol(),Signal_MA_TF,x)<MA_Signal(x))break;// Signal has already been processed on this cycle
               if(iLow(Symbol(),Signal_MA_TF,x)>MA_Signal(x))
               {
                  BarN=x;
                  SellNow=true;
                  break;
               }
            }
         }
      }
   }
   if(BuyNow==true || SellNow==true)Signal=true;
   return Signal;
}
获取预测因子的值:
将使用函数获得预测因子的值(其代码附在下面)。不过,我将向您展示如何为大量指标轻松完成这一点。我们将在三个点上使用指标值:第一个和第二个已经生成的柱,用于确定指标的信号水平,以及一个偏移15的柱-这允许了解指标的移动动态。当然,这是一种获取信息的简化方法,可以大大扩展。
所有的预测因子都将被写入一个在计算机内存中形成的表中。该表有一行;稍后将用作CatBoost模型解释器的输入数据向量
#include "CSV fast.mqh";                 // Class for working with tables
CSV *csv_CB=new CSV();                   // Create a table class instance, in which current predictor values will be stored

//+------------------------------------------------------------------+
//| Expert initialization function                                   |
//+------------------------------------------------------------------+
int OnInit()
{
   CB_Tabl();// Creating a table with predictors
   return(INIT_SUCCEEDED);
}
//+------------------------------------------------------------------+
//| Create a table with predictors                                   |
//+------------------------------------------------------------------+
void CB_Tabl()
{
//--- Columns for oscillators
   Size_arr_Buf_OSC=ArraySize(arr_Buf_OSC);
   Size_arr_Name_OSC=ArraySize(arr_Name_OSC);
   Size_TF_OSC=ArraySize(arr_TF_OSC);
   for(int n=0; n<Size_arr_Buf_OSC; n++)SummBuf_OSC=SummBuf_OSC+arr_Buf_OSC[n];
   Size_OSC=3*Size_TF_OSC*SummBuf_OSC;
   for(int S=0; S<3; S++)// Loop by the number of shifts
   {
      string Shift="0";
      if(S==0)Shift="1";
      if(S==1)Shift="2";
      if(S==2)Shift="15";
      for(int T=0; T<Size_TF_OSC; T++)// Loop by the number of timeframes
      {
         for(int o=0; o<Size_arr_Name_OSC; o++)// Loop by the number of indicators
         {
            for(int b=0; b<arr_Buf_OSC[o]; b++)// Loop by the number of indicator buffers
            {
               name_P=arr_Name_OSC[o]+"_B"+IntegerToString(b,0)+"_S"+Shift+"_"+arr_TF_OSC[T];
               csv_CB.Add_column(dt_double,name_P);// Add a new column with a name to identify a predictor
            }
         }
      }
   }
}
//+------------------------------------------------------------------+
//--- Call predictor calculation
//+------------------------------------------------------------------+
void Pred_Calc()
{
//--- Get information from oscillator indicators
   double arr_OSC[];
   iOSC_Calc(arr_OSC);
   for(int p=0; p<Size_OSC; p++)
   {
      csv_CB.Set_value(0,s(),arr_OSC[p],false);
   }
}
//+------------------------------------------------------------------+
//| Get values of oscillator indicators                              |
//+------------------------------------------------------------------+
void iOSC_Calc(double &arr_OSC[])
{
   ArrayResize(arr_OSC,Size_OSC);
   int n=0;// Indicator handle index
   int x=0;// Total number of iterations
   for(int S=0; S<3; S++)// Loop by the number of shifts
   {
      n=0;
      int Shift=0;
      if(S==0)Shift=1;
      if(S==1)Shift=2;
      if(S==2)Shift=15;
      for(int T=0; T<Size_TF_OSC; T++)// Loop by the number of timeframes
      {
         for(int o=0; o<Size_arr_Name_OSC; o++)// Loop by the number of indicators
         {
            for(int b=0; b<arr_Buf_OSC[o]; b++)// Loop by the number of indicator buffers
            {
               arr_OSC[x++]=iOSC(n, b,Shift);
            }
            n++;// Mark shift to the next indicator handle for calculation
         }
      }
   }
}
//+------------------------------------------------------------------+
//| Get the value of the indicator buffer                            |
//+------------------------------------------------------------------+
double iOSC(int OSC, int Bufer,int index)
{
   double MA[1]= {0.0};
   int handle_ind=arr_Handle[OSC];// Indicator handle
   ResetLastError();
   if(CopyBuffer(handle_ind,0,index,1,MA)<0)
   {
      PrintFormat("Failed to copy data from the OSC indicator, error code %d",GetLastError());
      return(0.0);
   }
   return (MA[0]);
}
样品积累和标记:
为了创建和保存样本,我们将通过将预测值从csv_CB表复制到csv_Arhiv表来累积预测值。
我们读取上一个信号的日期,确定交易的入场和出场价格并定义结果,根据结果来分配相应的标签:“1”-正,“0”-负。我们还要标记信号执行的交易类型,这将进一步有助于建立一个余额图:“1”-买入和“-1”-卖出。另外,让我们在这里计算一个交易操作的财务结果。财务结果将使用带有买入和卖出结果的单独列:当基本策略比较困难或有可能影响结果的头寸管理因素时,这是很方便的。
//+-----------------------------------------------------------------+
//| The function copies predictors to archive                       |
//+-----------------------------------------------------------------+
void Copy_Arhiv()
{
   int Strok_Arhiv=csv_Arhiv.Get_lines_count();// Number of rows in the table
   int Stroka_Load=0;// Starting row in the source table
   int Stolb_Load=1;// Starting column in the source table
   int Stroka_Save=0;// Starting row to write in the table
   int Stolb_Save=1;// Starting column to write in the table
   int TotalCopy_Strok=-1;// Number of rows to copy from the source. -1 copy to the last row
   int TotalCopy_Stolb=-1;// Number of columns to copy from the source, if -1 copy to the last column

   Stroka_Save=Strok_Arhiv;// Copy the last row
   csv_Arhiv.Copy_from(csv_CB,Stroka_Load,Stolb_Load,TotalCopy_Strok,TotalCopy_Stolb,Stroka_Save,Stolb_Save,false,false,false);// Copying function

//--- Calculate the financial result and set the target label, if it is not the first market entry
   int Stolb_Time=csv_Arhiv.Get_column_position("Time",false);// Find out the index of the "Time" column
   int Vektor_P=0;// Specify entry direction: "+1" - buy, "-1" - sell
   if(BuyNow==true)Vektor_P=1;// Buy entry
   else Vektor_P=-1;// Sell entry
   csv_Arhiv.Set_value(Strok_Arhiv,Stolb_Time+1,Vektor_P,false);
   if(Strok_Arhiv>0)
   {
      int Stolb_Target_P=csv_Arhiv.Get_column_position("Target_P",false);// Find out the index of the "Time" column
      int Load_Vektor_P=csv_Arhiv.Get_int(Strok_Arhiv-1,Stolb_Target_P,false);// Find out the previous operation type
      datetime Load_Data_Start=StringToTime(csv_Arhiv.Get_string(Strok_Arhiv-1,Stolb_Time,false));// Read the position opening date
      datetime Load_Data_Stop=StringToTime(csv_Arhiv.Get_string(Strok_Arhiv,Stolb_Time,false));// Read the position closing date
      double F_Rez_Buy=0.0;// Financial result in case of a buy operation
      double F_Rez_Sell=0.0;// Financial result in case of a sell operation
      double P_Open=0.0;// Position open price
      double P_Close=0.0;// Position close price
      int Metka=0;// Label for target variable
      P_Open=iOpen(Symbol(),Signal_MA_TF,iBarShift(Symbol(),Signal_MA_TF,Load_Data_Start,false));
      P_Close=iOpen(Symbol(),Signal_MA_TF,iBarShift(Symbol(),Signal_MA_TF,Load_Data_Stop,false));
      F_Rez_Buy=P_Close-P_Open;// Previous entry was buying
      F_Rez_Sell=P_Open-P_Close;// Previous entry was selling
      if((F_Rez_Buy-comission*Point()>0 && Load_Vektor_P>0) || (F_Rez_Sell-comission*Point()>0 && Load_Vektor_P<0))Metka=1;
      else Metka=0;
      csv_Arhiv.Set_value(Strok_Arhiv-1,Stolb_Time+2,Metka,false);// Write label to a cell
      csv_Arhiv.Set_value(Strok_Arhiv-1,Stolb_Time+3,F_Rez_Buy,false);// Write the financial result of a conditional buy operation to the cell
      csv_Arhiv.Set_value(Strok_Arhiv-1,Stolb_Time+4,F_Rez_Sell,false);// Write the financial result of a conditional sell operation to the cell
      csv_Arhiv.Set_value(Strok_Arhiv,Stolb_Time+2,-1,false);// Add a negative label to the labels to control labels
   }
}
使用模型:
让我们使用 Aliaksandr Hryshyn 的“Catboost.mqh”类,它可在此处下载,以解释使用CatBoost模型接收到的数据。
我添加了用于调试的“csv_Chek”表,必要时将保存CatBoost模型的值。
//+-----------------------------------------------------------------+
//| The function applies predictors in the CatBoost model           |
//+-----------------------------------------------------------------+
void Model_CB()
{
   CB_Siganl=1;
   csv_CB.Get_array_from_row(0,1,Solb_Copy_CB,features);
   double model_result=Catboost::ApplyCatboostModel(features,TreeDepth,TreeSplits,BorderCounts,Borders,LeafValues);
   double result=Logistic(model_result);
   if (result<Porog || result>Pridel)
   {
      BuyNow=false;
      SellNow=false;
      CB_Siganl=0;
   }
   if(Use_Save_Result==true)
   {
      int str=csv_Chek.Add_line();
      csv_Chek.Set_value(str,1,TimeToString(iTime(Symbol(),PERIOD_CURRENT,0),TIME_DATE|TIME_MINUTES));
      csv_Chek.Set_value(str,2,result);
   }
}
将所选内容保存到文件:
在测试过程结束时保存表,将小数点分隔符指定为逗号
//+------------------------------------------------------------------+
// Function writing predictors to a file                             |
//+------------------------------------------------------------------+
void Save_Pred_All()
{
//--- Save predictors to a file
   if(Save_Pred==true)
   {
      int Stolb_Target=csv_Arhiv.Get_column_position("Target_100",false);// Find out the index of the Target_100 column
      csv_Arhiv.Filter_rows_add(Stolb_Target,op_neq,-1,true);// Exclude lines with label "-1" in target variable
      csv_Arhiv.Filter_rows_apply(true);// Apply filter

      csv_Arhiv.decimal_separator=',';// Set a decimal separator
      string name=Symbol()+"CB_Save_Pred.csv";// File name
      csv_Arhiv.Write_to_file("Save_Pred\\"+name,true,true,true,true,false,5);// Save the file up to 5 characters
   }
//--- Save the model values to a debug file
   if(Use_Save_Result==true)
   {
      csv_Chek.decimal_separator=',';// Set a decimal separator
      string name=Symbol()+"Chek.csv";// File name
      csv_Chek.Write_to_file("Save_Pred\\"+name,true,true,true,true,false,5);// Save file up to 5 decimal places
   }
}
策略设置的自定义质量分数:
接下来,我们需要为基本模型使用的指标找到合适的设置。因此,让我们为strategy tester计算一个值,它确定交易的最小值并返回盈利交易的百分比。可用于训练(交易)的对象越多,样本就越均衡(盈利交易的百分比接近50%),训练就越好。自定义变量在下面的函数中计算。
//+------------------------------------------------------------------+
//| Custom variable calculating function                             |
//+------------------------------------------------------------------+
double CustomPokazatelf(int VariantPokazatel)
{
   double custom_Pokazatel=0.0;
   if(VariantPokazatel==1)
   {
      double Total_Tr=(double)TesterStatistics(STAT_TRADES);
      double Pr_Tr=(double)TesterStatistics(STAT_PROFIT_TRADES);
      if(Total_Tr>0 && Total_Tr>15000)custom_Pokazatel=Pr_Tr/Total_Tr*100.0;
   }
   return(custom_Pokazatel);
}
控制主代码部分的执行频率:
交易决定应该在新的酒吧开张时产生。这将通过以下功能进行检查:
//+-----------------------------------------------------------------+
//| Returns TRUE if a new bar has appeared on the current TF        |
//+-----------------------------------------------------------------+
bool isNewBar()
{
   datetime tm[];
   static datetime prevBarTime=0;

   if(CopyTime(Symbol(),Signal_MA_TF,0,1,tm)<0)
   {
      Print("%s CopyTime error = %d",__FUNCTION__,GetLastError());
   }
   else
   {
      if(prevBarTime!=tm[0])
      {
         prevBarTime=tm[0];
         return true;
      }
      return false;
   }
   return true;
}
交易功能:
专家顾问使用“cPoza6”交易类。这个想法是由我而起,主要的实现是由 Vasiliy Pushkaryov 提供的。我在莫斯科交易所测试了这个类,但是它的概念还没有完全实现。因此,我请大家改进它,也就是说,它需要处理历史的功能。在本文中,我禁用了帐户类型检查,所以请注意这一点。这个类最初是为净值(netting)账户开发的,但是它的操作在专家顾问中就足够了,允许读者在本文中学习机器学习。
以下是没有函数描述的专家顾问代码(为了清晰起见)。
如果我们不包括一些辅助函数并删除上述函数描述,那么EA代码如下所示:
//+------------------------------------------------------------------+
//| Expert initialization function                                   |
//+------------------------------------------------------------------+
int OnInit()
{
//--- Check the correctness of model response interpretation values
   if(Porog>=Pridel || Pridel<=Porog)return(INIT_PARAMETERS_INCORRECT);
   if(Use_Pred_Calc==true)
   {
      if(Init_Pred()==INIT_FAILED)return(INIT_FAILED);// Initialize indicator handles
      CB_Tabl();// Creating a table with predictors
      Solb_Copy_CB=csv_CB.Get_columns_count()-3;// Number of columns in the predictor table
   }
// Declare handle_MA_Slow
   handle_MA_Signal=iMA(Symbol(),Signal_MA_TF,Signal_MA_Period,1,Signal_MA_Metod,Signal_MA_Price);
   if(handle_MA_Signal==INVALID_HANDLE)
   {
      PrintFormat("Failed to create handle of the handle_MA_Signal indicator for the symbol %s/%s, error code %d",
                  Symbol(),EnumToString(Period()),GetLastError());
      return(INIT_FAILED);
   }
//--- Create a table to write model values - for debugging purposes
   if(Use_Save_Result==true)
   {
      csv_Chek.Add_column(dt_string,"Data");
      csv_Chek.Add_column(dt_double,"Rez");
   }
   return(INIT_SUCCEEDED);
}
//+------------------------------------------------------------------+
//| Expert deinitialization function                                 |
//+------------------------------------------------------------------+
void OnDeinit(const int reason)
{
   if(Save_Pred==true)Save_Pred_All();// Call a function to write predictors to a file
   delete csv_CB;// Delete the class instance
   delete csv_Arhiv;// Delete the class instance
   delete csv_Chek;// Delete the class instance
}
//+------------------------------------------------------------------+
//| Test completion event handler                                    |
//+------------------------------------------------------------------+
double OnTester()
{
   return(CustomPokazatelf(1));
}
//+------------------------------------------------------------------+
//| Expert tick function                                             |
//+------------------------------------------------------------------+
void OnTick()
{
//--- Operations are only executed when the next bar appears
   if(!isNewBar()) return;
//--- Get information on trading environment (deals/orders)
   OpenOrdersInfo();
//--- Get signal from the basic strategy
   if(Signal()==true)
   {
//--- Calculate predictors
      if(Use_Pred_Calc==true)Pred_Calc();
//---Apply the CatBoost model
      if(Use_Model_CB==true)Model_CB();
//--- If there is an open position at the signal generation time, close it
      if(PosType!="0")ClosePositions("Close Signal");
//--- Open a new position
      if (BuyNow==true)OpenPositions(BUY,1,0,0,"Open_Buy");
      if (SellNow==true)OpenPositions(SELL,1,0,0,"Open_Sell");
//--- Copy the table with the current predictors to the archive table
      if(Save_Pred==true)Copy_Arhiv();
   }
}
外部 EA 交易设置:
现在我们已经探讨了EA函数代码,让我们看看EA有哪些设置:
1. 配置预测因子的行为:
- "Calculate predictors" — 如果要保存选择或应用CatBoost模型就设为 "true";
- "Save predictors" — 如果您希望将预测值保存到文件中以供进一步训练就设为 "true";
- "Volume type in indicators" — 设置交易量类型: 报价点数(ticks)或是真实交易量;
- "Show predictor indicators on a chart" — 如果想要指标可视化就设为 true;
- "Commission and spread in points to calculate target" — 这用于考虑目标标签中的佣金和价差,以及过滤较小的正交易;
2. 基本策略信号的MA指标参数:
- "Period";
- "Timeframe";
- "MA methods";
- "Calculation price";
3. CatBoost模型应用参数:
- "Apply CatBoost model on data" — 用训练好的模型对专家顾问进行训练和编译后可以设为 "true";
- "Threshold for classifying one by the model" — 将模型值解释为1的阈值;
- "Limit for classifying one by the model" — 将模型值解释为1的限制;
- "Save model value to file" — 如果您希望获得一个文件来检查模型的正确性就设为 "true" .
找到正确的基本策略设置
现在,让我们优化基本策略指标。选择用于评估策略设置质量的自定义标准。我在2014年6月1日至2020年10月31日的时间范围内,使用 Otkritie Broker 的拼接 USDRUB_TOM Si期货合约(交易品种称为“Si Splice”)进行测试,时间范围为M1时间段。测试模式: M1 OHLC 模拟.
EA 交易的优化参数:
- "Period": 从 8 到 256,步长为 8;
- "Timeframe": 从 M1 到 D1, 没有步长;
- "MA methods": 从 SMA 到 LWMA, 没有步长;
- "Calculation price": 从 CLOSE 到 WEIGHTED.

图 1 "优化结果"
从这些结果中,我们需要选择具有高自定义参数的值—最好是35%或更高的值,以及15000个或更多的交易(越多越好)。或者,可以分析其他计量经济变量。
我准备了以下一组来演示使用机器学习创建交易策略的潜力:
- "Period": 8;
- "Timeframe": 2 Minutes (两分钟);
- "MA methods": Linear weighted (线性加权);
- "Calculation price": High price (最高价).
运行单个测试并检查结果图。

图 2 "学习之前的余额"
这种策略设置很难在交易中使用。信号非常嘈杂,有很多错误入场,让我们努力消除它们。与那些测试各种指标的多个参数来过滤信号从而在没有指标值或很少有指标值的领域花费额外计算能力的人不同(这在统计上是不重要的),我们将只处理那些指标值实际提供信息的领域。
让我们更改EA设置以计算和保存预测因子,然后运行一个测试:
配置预测因子的行为:
- "Calculate predictors" — 设为 "true";
- "Save predictors" — 设为 "true";
- "Volume type in indicators" — 设置交易量类型: 报价点数(ticks)或是真实交易量;
- "Show predictor indicators on a chart" — 使用 "false";
- "Commission and spread in points to calculate target" — 设为 50.
其余设置保持不变。让我们在StrategyTester中运行一个测试。计算执行得更慢,因为现在我们计算和收集了近2000个指标缓冲区的数据,以及计算其他预测因子。
在代理运行的路径下找到文件 (我使用了移动模式,所以我的是 "F:\FX\Otkritie Broker_Demo\Tester\Agent-127.0.0.1-3002\MQL5\Files", " 3002" 表示用于代理运行的线程) 并检查它的内容。如果包含数据表的文件已成功打开,则一切正常。
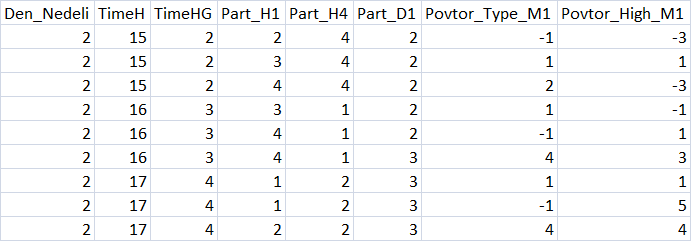
图 3 "预测因子表格摘要"
拆分样本
为了进一步训练,请将示例分成三部分并保存到文件中:
- train.csv — 用于训练的样本
- test.csv — 用于控制训练结果的样本,也用于停止训练
- exam.csv — 评估训练结果的样本
拆分样本要使用 script CB_CSV_to3x.mq5,
指定将在其中执行交易模型创建的目录的路径,以及包含示例的文件的名称。
另一个创建的文件是 Test_CB_Setup_0_000000000-它指定从0开始的列的索引,可以应用以下条件:禁用“Auxiliary(辅助)”标签并用“Label(标签)”标记目标列。我们样品的文件内容如下:
2408    Auxiliary
2409    Auxiliary
2410    Label
2411    Auxiliary
2412    Auxiliary
文件位于脚本准备的示例所在的同一位置。
CatBoost 参数
CatBoost 有各种影响训练结果的参数和设置;它们都在这里解释。我将在这里提到对模型训练结果有更大影响的主要参数(以及它们的键值,如果有的话),这些参数可以在CB_Bat脚本中配置:
- "Project directory" — 指定“Setup”示例所在目录的路径;
- "CatBoost exe file name" — 我使用了catboost-0.24.1.exe版本;您应该指定您使用的版本;
- "Boosting type (Model boosting scheme)" — 选择两个提升选项:
- Ordered — 小数据集的质量更好,但速度可能较慢。
- Plain — 经典的梯度提升方案。
- "Tree depth" (depth) — 对称决策树的深度,开发者推荐值在6到10之间;
- "Maximum iterations (trees)" — 解决机器学习问题时可以建立的最大树数;学习后的树数可以较少。如果测试或验证样本中没有出现模型改进,则迭代次数应与学习率参数的变化成比例地改变;
- "Learning rate" — 梯度步长,即建立每个后续决策树时的泛化准则。值越低,训练越慢,也越精确,但是这将花费更长的时间,并且将产生更多的迭代,所以不要忘记更改“Maximum number of iterations (trees)”;
- "Method for automated calculation of target class weights" (class-weights) — 此参数允许通过每个类中的多个示例来改进对不平衡样本的训练。三种不同的平衡方法:
- None — 所有类权重都设置为1
- Balanced — 基于总权重的类权重
- SqrtBalanced — 基于每个类中对象总数的类权重
- "Method for selecting object weights" (bootstrap-type) — 该参数负责在搜索预测因子以构建新树时如何计算对象。以下选项可用:
- Bayesian;
- Bernoulli;
- MVS;
- No;
- "Range of random weights for object selection" (bagging-temperature) — 当选择贝叶斯方法作为预测搜索的计算对象时,使用该方法。这个参数在为树选择预测值时会增加随机性,这有助于避免过度拟合和寻找模式。参数可以取从零到无穷大的值。
- "Frequency to sample weights and objects when building trees" (sampling-frequency) — 允许在构建树时更改预测因子重新评估的频率。支持的值:
- PerTree — 在构建每棵新树之前
- PerTreeLevel — 在选择树的每个新分支之前
- "Random subspace method (rsm) — 每个训练步骤1分析的预测因子百分比,1=100%。参数的减小加快了训练过程,增加了一些随机性,但增加了最终模型中的迭代次数(树);
- "L2 regularization" (l2-leaf-reg) — 从理论上讲,该参数可以减少过拟合,影响模型的质量;
- "The random seed used for training" (random-seed) — 通常是训练开始时随机权系数的发生器。根据我的经验,这个参数显著影响模型训练;
- "The amount of randomness to score the tree structure (random-strength)" — 此参数在创建树时会影响狭缝分数,对其进行优化以提高模型质量;
- "Number of gradient steps to select a value from the list" (leaf-estimation-iterations) — 当树已经建好的时候,叶子就会被计算在内。它们可以向前数几个梯度步-这个参数影响训练质量和速度;
- "The quantization mode for numerical features" (feature-border-type) — 此参数负责对样本对象执行不同的量化算法。参数对模型的可训练性影响很大。支持的值:
- Median,
- Uniform,
- UniformAndQuantiles,
- MaxLogSum,
- MinEntropy,
- GreedyLogSum,
- "The number of splits for numerical features" (border-count) — 此参数负责每个预测因子的整个值范围的分割数。分裂的数量通常较少。参数越大,分割越窄 -> 示例百分比越低。对学习种子和学习质量有显著影响;
- "Save borders to a file" (output-borders-file) — 量化边界可以保存到一个文件中,以便在后续的训练中进行进一步的分析。它会影响学习速度,因为每次创建模型时都会保存数据;
- "Error score metrics for learning correction" (loss-function) — 训练模型时用来评估错误分数的函数。我没有注意到对结果的重大影响。有两种选择:
- Logloss;
- CrossEntropy;
- "The number trees without improvements to stop training" (od-wait) — 如果训练很快停止,试着增加等待的次数。学习速度变化时也要改变参数:速度越低,完成训练前等待改进的时间越长;
- "Error score metric function to training" (eval-metric) — 允许从列表中选择一个度量,根据该度量树将被截断并停止训练。支持的量度:
- Logloss;
- CrossEntropy;
- Precision;
- Recall;
- F1;
- BalancedAccuracy;
- BalancedErrorRate;
- MCC;
- Accuracy;
- CtrFactor;
- NormalizedGini;
- BrierScore;
- HingeLoss;
- HammingLoss;
- ZeroOneLoss;
- Kappa;
- WKappa;
- LogLikelihoodOfPrediction;
- "Sample object" — 允许选择模型参数进行训练。选项:
- No
- Random-seed — 用于训练的值
- Random-strength — 评估树结构的随机性数量
- Border-count — 切分的次数
- l2-Leaf-reg — L2 规范化
- Bagging-temperature — 用于选择对象的随机权重范围
- Leaf_estimation_iterations — 从列表中选择值的渐变步数
- "Initial variable value" — 设置训练开始的位置
- "End variable value" — 设定训练结束的位置
- "Step" — 数值变化步长
- "Classification result presentation type"(prediction-type) — 如何编写模型响应-不影响训练,在训练后将模型应用于样本时使用:
- Probability
- Class
- RawFormulaVal
- Exponent
- LogProbability
- "The number of trees in the model, 0 - all" — 模型中用于分类的树的数量,允许在模型应用于样本时评估分类质量的变化
- "Model analysis method" (fstr-type) —各种模型分析方法可以评估某一模型的预测显著性。 请分享你对它们的看法。支持的选项:
- PredictionValuesChange — 对象值更改时预测如何更改
- LossFunctionChange — 排除对象时预测如何更改
- InternalFeatureImportance
- Interaction
- InternalInteraction
- ShapValues
该脚本允许搜索多个模型设置参数。为此,请选择“NONE”以外的对象,并指定起始值、结束值和步长。
学习策略
我将学习策略分为三个阶段:
- 基本设置是负责模型中树的深度和数量的参数,以及用于开始训练过程的训练速率、类权重和其他设置。不会搜索这些参数;在大多数情况下,脚本生成的默认设置就足够了。
- 搜索最优分割参数 - CatBoost 对预测因子表进行预处理,沿网格边界搜索值范围,因此我们需要找到一个训练效果更好的网格。迭代范围为8-512的所有网格类型是有意义的;我在每个值上使用步长增量:8、16、32等等。
- 再次配置脚本,指定找到的预测因子量化网格,然后我们可以继续处理进一步的参数。通常我只在1-1000范围内使用“Seed”。
在本文中,对于第一个“学习策略”阶段,我们将使用CB_Bat默认设置。拆分方法将设置为“MinEntropy”,网格将测试16到512之间的参数,步长为16。
为了设置上述参数,让我们使用“CB_Bat”脚本,该脚本将创建包含训练模型所需键的文本文件,以及一个辅助文件:
- _00_Dir_All.txt - 辅助文件
- _01_Train_All.txt - 训练设置
- _02_Rezultat_Exam.txt - 按检查样本模型记录分类的设置
- _02_Rezultat_test.txt - 按测试样本模型记录分类的设置
- _02_Rezultat_Train.txt - 按学习样本模型记录分类的设置
- _03_Metrik_Exam.txt - 用于记录检查样本模型的每个树的度量的设置
- _03_Metrik_Test.txt - 用于记录测试样本模型的每个树的度量的设置
- _03_Metrik_Train.txt - 用于记录训练样本模型的每个树的度量的设置
- _04_Analiz_Exam.txt - 用于记录检查样本模型的预测值重要性评估的设置
- _04_Analiz_Test.txt - 用于记录测试样本模型的预测重要性评估的设置
- _04_Analiz_Train.txt - 用于记录训练样本模型的预测值重要性评估的设置
我们可以创建一个文件,在训练之后按顺序执行操作。但是为了优化CPU利用率(这在早期版本的 CatBoost 中尤其重要),我在训练之后启动了6个文件。
模型的训练
文件准备好后,重命名文件“_00_Dir_All.txt”到“_00_Dir_All.bat”并运行它-它将创建定位模型所需的目录,并将其他文件的扩展名更改为“bat”。
现在,我们的项目目录包含“Setup”文件夹,其中包含以下内容:
- _00_Dir_All.bat - 辅助文件
- _01_Train_All.bat - 训练的设置
- _02_Rezultat_Exam.bat - 按检查样本模型记录分类的设置
- _02_Rezultat_test.bat - 按测试样本模型记录分类的设置
- _02_Rezultat_Train.bat — 按学习样本模型记录分类的设置
- _03_Metrik_Exam.bat — 用于记录检查样本模型的每个树的度量的设置
- _03_Metrik_Test.bat — 用于记录测试样本模型的每个树的度量的设置
- _03_Metrik_Train.bat — 用于记录训练样本模型的每个树的度量的设置
- _04_Analiz_Exam.bat — 用于记录检查样本模型的预测值重要性评估的设置
- _04_Analiz_Test.bat — 用于记录测试样本模型的预测重要性评估的设置
- _04_Analiz_Train.bat — 用于记录训练样本模型的预测值重要性评估的设置
- catboost-0.24.1.exe — 用于训练 CatBoost 模型的可执行文件
- train.csv — 用于训练的样本
- test.csv — 用于控制训练结果的样本,也用于停止训练
- exam.csv — 用于评估结果的样本
- Test_CB_Setup_0_000000000//包含有关用于训练的示例列的信息的文件
运行 "_01_Train_All.bat" 并观察训练过程。
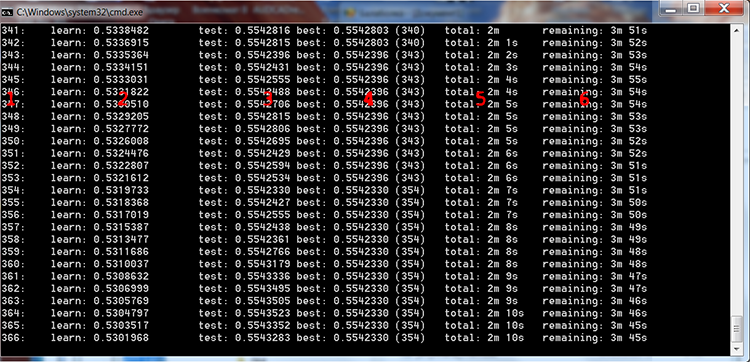
图 4 CatBoost 训练过程
我在上图中添加了红色数字来描述这些列:
- 树的数目,等于迭代的次数
- 在训练样本上计算所选损失函数的结果
- 对控制样本计算所选损失函数的结果
- 对控制样本计算所选损失函数的最佳结果
- 模型训练开始后经过的实际时间
- 如果训练设置指定的所有树,则训练结束前的估计剩余时间
如果我们在脚本设置中选择一个搜索范围,模型将根据文件内容在一个循环中进行多次训练:
FOR %%a IN (*.) DO (
catboost-0.24.1.exe fit  --learn-set train.csv   --test-set test.csv     --column-description %%a        --has-header    --delimiter ;   --model-format CatboostBinary,CPP       --train-dir ..\Rezultat\RS_16\result_4_%%a      --depth 6       --iterations 1000       --nan-mode Forbidden    --learning-rate 0.03    --rsm 1         --fold-permutation-block 1      --boosting-type Plain   --l2-leaf-reg 6         --loss-function Logloss         --use-best-model        --eval-metric Logloss   --custom-metric Logloss         --od-type Iter  --od-wait 100   --random-seed 0         --random-strength 1     --auto-class-weights SqrtBalanced       --sampling-frequency PerTreeLevel       --border-count 16       --feature-border-type MinEntropy        --output-borders-file quant_4_00016.csv         --bootstrap-type Bayesian       --bagging-temperature 1         --leaf-estimation-method Newton         --leaf-estimation-iterations 10
catboost-0.24.1.exe fit  --learn-set train.csv   --test-set test.csv     --column-description %%a        --has-header    --delimiter ;   --model-format CatboostBinary,CPP       --train-dir ..\Rezultat\RS_32\result_4_%%a      --depth 6       --iterations 1000       --nan-mode Forbidden    --learning-rate 0.03    --rsm 1         --fold-permutation-block 1      --boosting-type Plain   --l2-leaf-reg 6         --loss-function Logloss         --use-best-model        --eval-metric Logloss   --custom-metric Logloss         --od-type Iter  --od-wait 100   --random-seed 0         --random-strength 1     --auto-class-weights SqrtBalanced       --sampling-frequency PerTreeLevel       --border-count 32       --feature-border-type MinEntropy        --output-borders-file quant_4_00032.csv         --bootstrap-type Bayesian       --bagging-temperature 1         --leaf-estimation-method Newton         --leaf-estimation-iterations 10
catboost-0.24.1.exe fit  --learn-set train.csv   --test-set test.csv     --column-description %%a        --has-header    --delimiter ;   --model-format CatboostBinary,CPP       --train-dir ..\Rezultat\RS_48\result_4_%%a      --depth 6       --iterations 1000       --nan-mode Forbidden    --learning-rate 0.03    --rsm 1         --fold-permutation-block 1      --boosting-type Plain   --l2-leaf-reg 6         --loss-function Logloss         --use-best-model        --eval-metric Logloss   --custom-metric Logloss         --od-type Iter  --od-wait 100   --random-seed 0         --random-strength 1     --auto-class-weights SqrtBalanced       --sampling-frequency PerTreeLevel       --border-count 48       --feature-border-type MinEntropy        --output-borders-file quant_4_00048.csv         --bootstrap-type Bayesian       --bagging-temperature 1         --leaf-estimation-method Newton         --leaf-estimation-iterations 10
catboost-0.24.1.exe fit  --learn-set train.csv   --test-set test.csv     --column-description %%a        --has-header    --delimiter ;   --model-format CatboostBinary,CPP       --train-dir ..\Rezultat\RS_64\result_4_%%a      --depth 6       --iterations 1000       --nan-mode Forbidden    --learning-rate 0.03    --rsm 1         --fold-permutation-block 1      --boosting-type Plain   --l2-leaf-reg 6         --loss-function Logloss         --use-best-model        --eval-metric Logloss   --custom-metric Logloss         --od-type Iter  --od-wait 100   --random-seed 0         --random-strength 1     --auto-class-weights SqrtBalanced       --sampling-frequency PerTreeLevel       --border-count 64       --feature-border-type MinEntropy        --output-borders-file quant_4_00064.csv         --bootstrap-type Bayesian       --bagging-temperature 1         --leaf-estimation-method Newton         --leaf-estimation-iterations 10
catboost-0.24.1.exe fit  --learn-set train.csv   --test-set test.csv     --column-description %%a        --has-header    --delimiter ;   --model-format CatboostBinary,CPP       --train-dir ..\Rezultat\RS_80\result_4_%%a      --depth 6       --iterations 1000       --nan-mode Forbidden    --learning-rate 0.03    --rsm 1         --fold-permutation-block 1      --boosting-type Plain   --l2-leaf-reg 6         --loss-function Logloss         --use-best-model        --eval-metric Logloss   --custom-metric Logloss         --od-type Iter  --od-wait 100   --random-seed 0         --random-strength 1     --auto-class-weights SqrtBalanced       --sampling-frequency PerTreeLevel       --border-count 80       --feature-border-type MinEntropy        --output-borders-file quant_4_00080.csv         --bootstrap-type Bayesian       --bagging-temperature 1         --leaf-estimation-method Newton         --leaf-estimation-iterations 10
catboost-0.24.1.exe fit  --learn-set train.csv   --test-set test.csv     --column-description %%a        --has-header    --delimiter ;   --model-format CatboostBinary,CPP       --train-dir ..\Rezultat\RS_96\result_4_%%a      --depth 6       --iterations 1000       --nan-mode Forbidden    --learning-rate 0.03    --rsm 1         --fold-permutation-block 1      --boosting-type Plain   --l2-leaf-reg 6         --loss-function Logloss         --use-best-model        --eval-metric Logloss   --custom-metric Logloss         --od-type Iter  --od-wait 100   --random-seed 0         --random-strength 1     --auto-class-weights SqrtBalanced       --sampling-frequency PerTreeLevel       --border-count 96       --feature-border-type MinEntropy        --output-borders-file quant_4_00096.csv         --bootstrap-type Bayesian       --bagging-temperature 1         --leaf-estimation-method Newton         --leaf-estimation-iterations 10
catboost-0.24.1.exe fit  --learn-set train.csv   --test-set test.csv     --column-description %%a        --has-header    --delimiter ;   --model-format CatboostBinary,CPP       --train-dir ..\Rezultat\RS_112\result_4_%%a     --depth 6       --iterations 1000       --nan-mode Forbidden    --learning-rate 0.03    --rsm 1         --fold-permutation-block 1      --boosting-type Plain   --l2-leaf-reg 6         --loss-function Logloss         --use-best-model        --eval-metric Logloss   --custom-metric Logloss         --od-type Iter  --od-wait 100   --random-seed 0         --random-strength 1     --auto-class-weights SqrtBalanced       --sampling-frequency PerTreeLevel       --border-count 112      --feature-border-type MinEntropy        --output-borders-file quant_4_00112.csv         --bootstrap-type Bayesian       --bagging-temperature 1         --leaf-estimation-method Newton         --leaf-estimation-iterations 10
catboost-0.24.1.exe fit  --learn-set train.csv   --test-set test.csv     --column-description %%a        --has-header    --delimiter ;   --model-format CatboostBinary,CPP       --train-dir ..\Rezultat\RS_128\result_4_%%a     --depth 6       --iterations 1000       --nan-mode Forbidden    --learning-rate 0.03    --rsm 1         --fold-permutation-block 1      --boosting-type Plain   --l2-leaf-reg 6         --loss-function Logloss         --use-best-model        --eval-metric Logloss   --custom-metric Logloss         --od-type Iter  --od-wait 100   --random-seed 0         --random-strength 1     --auto-class-weights SqrtBalanced       --sampling-frequency PerTreeLevel       --border-count 128      --feature-border-type MinEntropy        --output-borders-file quant_4_00128.csv         --bootstrap-type Bayesian       --bagging-temperature 1         --leaf-estimation-method Newton         --leaf-estimation-iterations 10
catboost-0.24.1.exe fit  --learn-set train.csv   --test-set test.csv     --column-description %%a        --has-header    --delimiter ;   --model-format CatboostBinary,CPP       --train-dir ..\Rezultat\RS_144\result_4_%%a     --depth 6       --iterations 1000       --nan-mode Forbidden    --learning-rate 0.03    --rsm 1         --fold-permutation-block 1      --boosting-type Plain   --l2-leaf-reg 6         --loss-function Logloss         --use-best-model        --eval-metric Logloss   --custom-metric Logloss         --od-type Iter  --od-wait 100   --random-seed 0         --random-strength 1     --auto-class-weights SqrtBalanced       --sampling-frequency PerTreeLevel       --border-count 144      --feature-border-type MinEntropy        --output-borders-file quant_4_00144.csv         --bootstrap-type Bayesian       --bagging-temperature 1         --leaf-estimation-method Newton         --leaf-estimation-iterations 10
catboost-0.24.1.exe fit  --learn-set train.csv   --test-set test.csv     --column-description %%a        --has-header    --delimiter ;   --model-format CatboostBinary,CPP       --train-dir ..\Rezultat\RS_160\result_4_%%a     --depth 6       --iterations 1000       --nan-mode Forbidden    --learning-rate 0.03    --rsm 1         --fold-permutation-block 1      --boosting-type Plain   --l2-leaf-reg 6         --loss-function Logloss         --use-best-model        --eval-metric Logloss   --custom-metric Logloss         --od-type Iter  --od-wait 100   --random-seed 0         --random-strength 1     --auto-class-weights SqrtBalanced       --sampling-frequency PerTreeLevel       --border-count 160      --feature-border-type MinEntropy        --output-borders-file quant_4_00160.csv         --bootstrap-type Bayesian       --bagging-temperature 1         --leaf-estimation-method Newton         --leaf-estimation-iterations 10
)
训练结束后,我们将立即启动剩余的6个bat文件,以标签和统计值的形式获取训练结果。
学习结果的评估解释
让我们使用CB_Calc__Svod.mq5版本脚本以获取模型的度量变量及其财务结果。
这个脚本有一个过滤器,用于通过检查样本上的最终余额来选择模型:如果余额高于某个值,则可以从样本和转换为mqh的样本构建余额图,并将其保存到CatBoost模型项目的单独目录中。
等待脚本完成—在本例中,您将看到新创建的“Analiz”文件夹,其中包含 CB_Svod.csv 文件,以及根据模型名称而来的余额图(如果在设置中选择了它们的打印),以及包含转换为mqh 格式的模型的“Models_mqh”目录。
CB_Svod.csv 文件将包含各个样本中每个模型的指标以及财务结果。
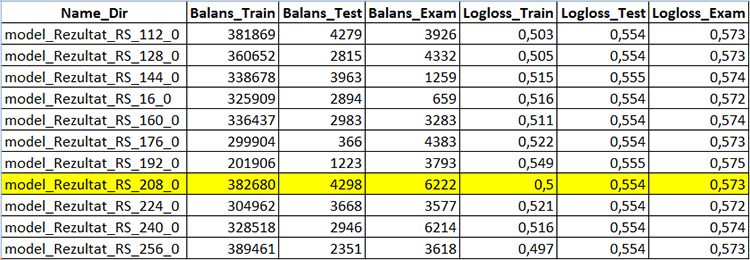
图 5 包含模型创建结果的表的一部分 - CB_Svod.csv
从我们的模型训练目录的 Models_mqh 子目录中选择您喜欢的模型,并将其添加到 Expert Advisor 目录中。在EA代码的开头使用“//”注释掉空缓冲区代码行。现在,我们只需要将模型文件连接到 EA:
//If the CatBoost model is in an mqh file, comment the below line
//uint TreeDepth[];uint TreeSplits[];uint BorderCounts[];float Borders[];double LeafValues[];double Scale[];double Bias[];
#include "model_RS_208_0.mqh";                 // Model file
编译完专家顾问后,将“Apply CatBoost model on data”设置设为“true”,禁用样本保存并使用以下参数运行策略测试器。
1. 配置预测因子的行为:
- "Calculate predictors" — 设为 "true";
- "Save predictors" — 设为 "false"
- "Volume type in indicators" — 选择您在训练中使用的交易量类型
- "Show predictor indicators on a chart" — 使用 "false"
- "Commission and spread in points to calculate target" — 使用之前的值,它不影响训练好的模型
2. 基本策略信号的MA指标参数:
- "Period": 8;
- "Timeframe": 2 Minutes (两分钟);
- "MA methods": Linear weighted (线性加权);
- "Calculation price": High price (最高价).
3. CatBoost模型应用参数:
- "Apply CatBoost model on data" — 设为 "true"
- "Threshold for classifying one by the model" — 保留为 0.5
- "Limit for classifying one by the model" — 保留为 1
- "Save model value to file" — 保留为 "false"
在整个采样期间收到以下结果。
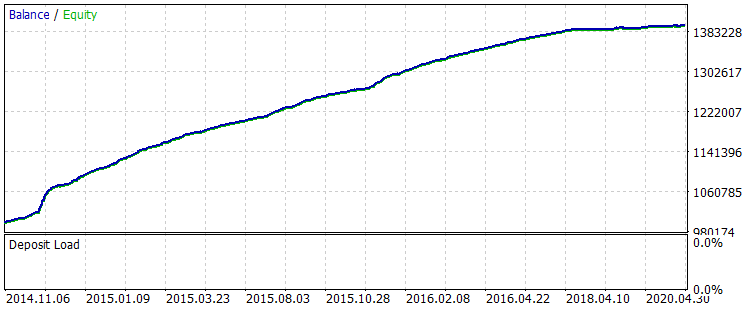
图 6 在2014年6月1日-2020年10月31日期间训练后的余额
让我们看一下从2019年8月1日到2020年10月31日的期间上的两个余额图,这对应着 exam.csv 样本,训练前后的比较。
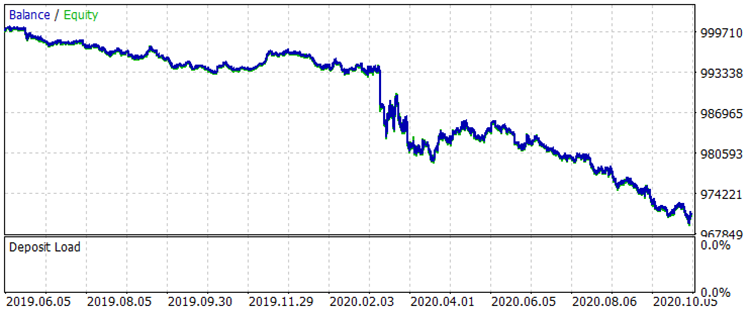
图 7 训练前 01.08.2019 - 31.10.2020 期间的余额
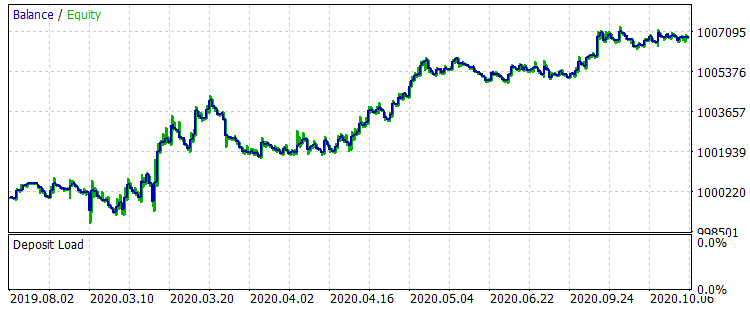
图 8 训练后 01.08.2019 - 31.10.2020 期间的余额
结果不是很特别出众,但可以注意到,主要的交易规则“避免金钱损失”是遵守的。即使我们从 CB_Svod.csv 文件中选择另一个模式,效果仍然是正面的,因为我们得到的最失败的模型的财务结果是-25个点,所有模型的平均财务结果是3889.9个点。
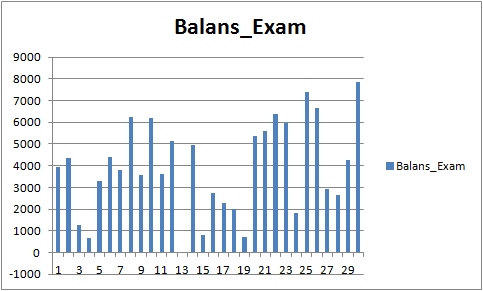
图 9 对于期间 01.08.2019 - 31.10.2020 的已训练模型的财务结果
预测因子分析
每个模型目录(对于我是 MQL5\Files\CB_Stat_03p50Q\Rezultat\RS_208\result_4_Test_CB_Setup_0_000000000) 有三个文件:
- Analiz_Train — 训练样本的预测因子重要性分析
- Analiz_Test — 检验(验证)样本的预测因子重要性分析
- Analiz_Exam — 测试(训练外)样本的预测因子重要性分析
根据生成训练文件时选择的“模型分析方法”,内容将有所不同。让我们来看 "PredictionValuesChange" 的内容。
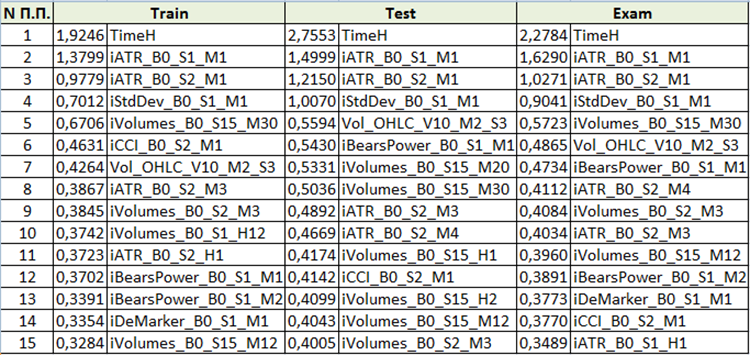
图 10 预测因子重要性分析汇总表
基于对预测因子重要性的评估,我们可以得出结论,前四个预测因子对结果模型始终是重要的。请注意,预测因子的重要性不仅取决于模型本身,还取决于原始样本。如果预测因子在这个样本中没有足够的值,那么它就不能被客观地评估。这种方法可以理解预测因子重要性的一般概念。但是,在使用基于交易品种的样本时请小心。
结论
- 机器学习方法的有效性,例如梯度提升,可以与无休止的参数迭代和手动创建额外的交易条件来提高策略性能相比。
- 标准MetaTrader 5指标可以用于机器学习。
- CatBoost — 是一个高质量的库,它有一个包装器,可以在不学习 Python 或 R 的情况下高效地使用梯度提升。
结论
本文的目的是提请您注意机器学习,我真的希望详细的方法描述和提供的复制工具将导致新的机器学习爱好者的出现。让我们团结起来,努力寻找有关机器学习的新思想,特别是寻找预测因子的理想方法。模型的质量取决于输入数据和目标,通过我们的共同努力,我们可以更快地达到预期的结果。
非常欢迎您报告我的文章和代码中包含的错误。