Implementing a Scalping Market Depth Using the CGraphic Library
Vasiliy Sokolov | 26 October, 2017
Table of Contents
- Introduction
- Changes made since the release of previous version
- Overview of the CPanel graphics library
- Synchronizing the tick stream with the order book
- CGraphic Basics
- Integration of CGraphic with the CPanel library
- Installation. Performance in dynamics. Comparative characteristics of Market Depth features
- Conclusion
Introduction
This article is a logical continuation of the Market Depth related library description published two years ago. Since then, access to tick history has been implemented in MQL5. MetaQuotes have also released the CGraphic library which allows visualizing custom data as complex statistical graphics. The purpose of CGraphic is similar to the plot function in the R programming language. Use of this library is described in detail in a separate article.
The introduction of these possibilities allowed to greatly modernize the earlier offered Market Depth. In addition to the order book, a tick chart with Last trades is also displayed in the new version:
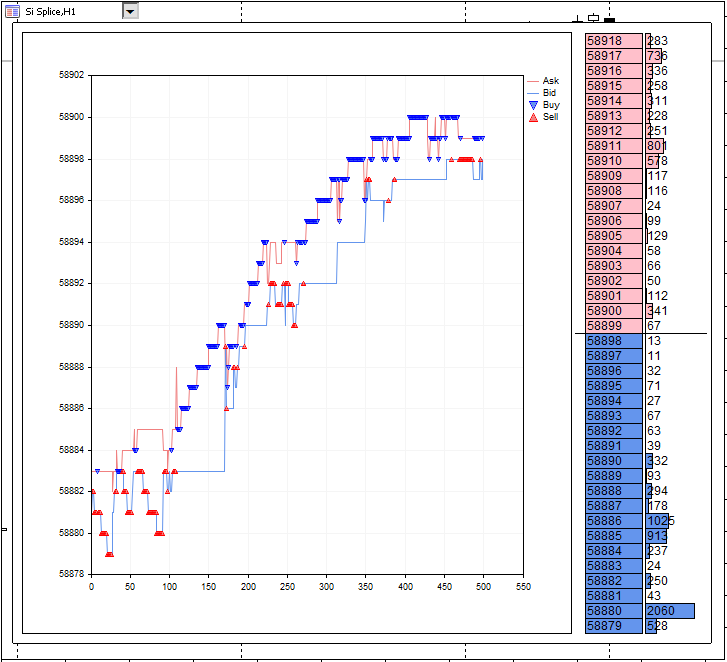
Fig. 1. The Market Depth with a tick chart.
The previous library version consisted of two major modules: the CMarketBook class for working with the Market Depth and a graphical panel that rendered it. The code has been changed and improved greatly. A number of bugs have been fixed, while the graphics part of the Market Depth now has its own CPanel graphics library which is simple and lightweight.
Let's get back to CGraphic and its ability to draw complex diagrams and linear charts in a separate window. It would seem that such specific functionality would only be useful for statistical problems. But that's not so! In this article, I'll try to show how CGraphic capabilities can be used in projects that are far from statistics—for example, when creating a scalping Market Depth.
Changes made since the release of previous version
After publishing the article "MQL5 Cookbook: Implementing Your Own Depth of Market", I used CMarketBook a lot in practice and found a number of errors in the code. I gradually modified the interface. Here are all changes and updates:
- The original graphics in the Market Depth window were very minimalistic. Order book table cells were displayed using a few elementary classes. After a while additional functionality was implemented in these classes, and their simplicity and lightness proved to be very convenient when designing other types of panels. As a results, the set of classes emerged into a separate independent project - the CPanel library. It is located in the Include folder.
- The appearance of the Market Depth has also been improved. For example, a small triangle has been replaced with a large square button that opens and closes the Market Depth window. Overlapping of elements has been fixed (in case of table re-opening, the Market Depth elements were drawn again on top of existing ones).
- New settings allow to change the position of the button that opens/closes the Market Depth window along the X and Y axes of the chart. Often, due to the non-standard symbol name and an additional trading panel, the Market Depth opening/closing button could cover other active elements of the chart. The new possibility to manually set the location of the button allows to avoid such overlapping.
- The CMarketBook class has changed greatly. The following errors have been fixed in this class: array out of range errors; errors with an empty or partially filled order book; zero divide error when changing the symbol. The CMarketBook class is now an independent module, which is located at MQL5\Include\Trade;
- A number of minor changes have been implemented in order to improve the overall stability of the indicator.
Now, we will start to work with this improved and revised version trying to gradually turn it into a scalping Market Depth tool.
Overview of the CPanel graphics library
There are many articles devoted to the creation of user interfaces in MQL5. Anatoly Kazharsky's "Graphical Interfaces" series stands out among them. It is difficult to add anything new after these articles. Therefore, we will not analyze creation of a graphical interface in detail. As already mentioned above, the graphical part of the Market Depth is now available as a fully featured CPanel library. Its basic architecture needs to be described, because we will create a special graphic element "Tick Chart" based on this library. It will be combined with an order book to create a full-featured panel with several elements.
Let us consider CPanel in detail in order to understand further operating principle. Graphical elements in MQL5 are represented as a few graphic primitives. They include:
- a text label
- a button
- an input box
- a rectangular label
- a bitmap label
All of them have a number of identical properties. For example, a rectangular label, a button and an input box can be configured so that it would be hard to distinguish between them. Thus, an element can be based on almost any graphic primitive. For example, an input box can be displayed instead of a button, or a button can be shown instead of a rectangular label. Visually, such a substitution will be unnoticeable, and the user clicking on the input box will think that he actually presses a button.
It may seem that such substitution may be strange and may complicate the general understanding of UI creating principles. But we must understand that in addition to common characteristics, each basic element has its own unique property. For example, an input box cannot be made transparent, while a rectangular label can. Therefore it is possible to create elements with a unique view from the same classes.
This can be shown by an example. Suppose we need to create a graphical panel with a traditional text label:
Fig. 2. An example of a form with a text without a frame.
But if we want to add a frame, we will have problems, because the text label does not have the "frame" property. The solution is simple: we will use a button instead of a text label! Here is a form with the button:
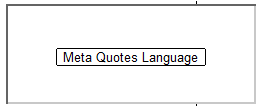
Fig. 3. An example of a form with a text in a frame.
A lot of similar cases may arise when creating a graphical interface. It's impossible to predict in advance what a user may need. Therefore, it would be better not to base a graphic element on a particular primitive, but to give the user the opportunity to determine it.
This is how the CPanel library of elements is arranged. CPanel is a set of classes each of which represents a certain element of a high-level graphical interface. To initialize such an element, we need to specify the type of a graphic primitive which it is based on. Each such class has a common parent, the CNode class, which performs only one function, i.e. stores the type of the basic primitive. Its only protected constructor requires type specification during element creation.
There are very few unique high-level graphical elements. The so called uniqueness depends on the set of properties that should be assigned to the basic element in order to make it unique. In CPanel, such a unique element is the CElChart class. Similar to all other classes, it is derived from CNode, and it contains methods for configuring the following properties:
- the length and height of an element,
- the X and Y coordinates of the element relative to the chart,
- the width and the height of the element,
- the color of the element background and frame (if such properties are supported),
- the type of the element frame (if this property is supported),
- text inside the element, its font, size, and alignment (if such properties are supported).
CElChart provides methods for setting properties, but it does not guarantee that these properties will actually be placed. Only the basic element determines whether CElChart will support a certain property. Similar to CNode, CElChart requires the specification of the type of a graphic primitive which it is based on. Thus, the use of CElChart allows you to create both a regular form and, for example, a button or a text field. It is a very convenient feature in practice.
Example: let us draw a panel, as in figure 3. We need two elements: a background with a frame and a text with a frame. Both of them are instances of the same CElChart class. But two different graphical primitives are used in them: OBJ_RECTANGLE_LABEL and BJ_BUTTON. Here is the resulting code:
//+------------------------------------------------------------------+
//|                                       MarketBookArticlePanel.mq5 |
//|                        Copyright 2017, MetaQuotes Software Corp. |
//|                                             https://www.mql5.com |
//+------------------------------------------------------------------+
#property copyright "Copyright 2017, MetaQuotes Software Corp."
#property link      "https://www.mql5.com"
#property version   "1.00"
#include <Panel\ElChart.mqh>

CElChart Fon(OBJ_RECTANGLE_LABEL);
CElChart Label(OBJ_BUTTON);
//+------------------------------------------------------------------+
//| Expert initialization function                                   |
//+------------------------------------------------------------------+
int OnInit()
{
//---
   Fon.Height(100);
   Fon.Width(250);
   Fon.YCoord(200);
   Fon.XCoord(200);
   Fon.BackgroundColor(clrWhite);
   Fon.BorderType(BORDER_FLAT);
   Fon.BorderColor(clrBlack);
   Fon.Show();

   Label.Text("Meta Quotes Language");
   Label.BorderType(BORDER_FLAT);
   Label.BorderColor(clrBlack);
   Label.Width(150);
   Label.Show();
   Label.YCoord(240);
   Label.XCoord(250);
   ChartRedraw();
//---
   return(INIT_SUCCEEDED);
}
//+------------------------------------------------------------------+
//| Expert tick function                                             |
//+------------------------------------------------------------------+
void OnTick()
  {
//---

  }
//+------------------------------------------------------------------+
Once all elements are created, we need to set their properties in the OnInit function. Now elements can be displayed on the chart by calling their Show methods.
By combining the basic primitive and the CElChart class, we can create powerful, flexible, and, most importantly, simple graphical interfaces. The graphical display of the Market Depth is arranged similarly. The order book consists of multiple CBookCell elements which are based on CElChart.
The CPanel graphics engine supports nesting. This means that additional elements can be placed inside one element. The nesting enables the universal control. For example, a command given for a global form can be sent to all of its sub-elements. Let's modify the example above:
//+------------------------------------------------------------------+
//|                                       MarketBookArticlePanel.mq5 |
//|                        Copyright 2015, MetaQuotes Software Corp. |
//|                                             https://www.mql5.com |
//+------------------------------------------------------------------+
#property copyright "Copyright 2015, MetaQuotes Software Corp."
#property link      "https://www.mql5.com"
#property version   "1.00"
#include <Panel\ElChart.mqh>

CElChart Fon(OBJ_RECTANGLE_LABEL);
CElChart *Label;
//+------------------------------------------------------------------+
//| Expert initialization function                                   |
//+------------------------------------------------------------------+
int OnInit()
{
//---
   Fon.Height(100);
   Fon.Width(250);
   Fon.YCoord(200);
   Fon.XCoord(200);
   Fon.BackgroundColor(clrWhite);
   Fon.BorderType(BORDER_FLAT);
   Fon.BorderColor(clrBlack);

   Label = new CElChart(OBJ_BUTTON);
   Label.Text("Meta Quotes Language");
   Label.BorderType(BORDER_FLAT);
   Label.BorderColor(clrBlack);
   Label.Width(150);
   Label.YCoord(240);
   Label.XCoord(250);
   //Label.Show();
   Fon.AddElement(Label);

   Fon.Show();
   ChartRedraw();
//---
   return(INIT_SUCCEEDED);
}

//+------------------------------------------------------------------+
//| Expert tick function                                             |
//+------------------------------------------------------------------+
void OnTick()
  {
//---

  }
Now, during program execution, CLabel which is a pointer to the CElCahrt element is dynamically created. After creation and appropriate comfiguration, it is added to the Form. Now there is no need to display it using a separate Show command. Instead, it is enough to run the Show command for the Fon element, which is the main form of our app. Due to specifics, the command is executed for all sub-elements, including Label.
In addition to setting element properties, CPanel supports an advanced event model. Not only an event received from a chart, but anything can be an event in CPanel. This feature is provided by the CEvent class and the Event method. CEvent is an abstract class. A lot of more specific classes are based on it, for example CEventChartObjClick.
Suppose our user form has a few nested sub-elements. A user can create one event, e.g. he can click on any of these elements. How do we know which instance of the class should handle the event? For this purpose we will use the CEventChartObjClick event: let us create a class instance and send it to the central Form:
CElChart Fon(OBJ_RECTANGLE_LABEL);
...
...
void OnChartEvent(const int id,         // event identifier
                  const long& lparam,   // event parameter of long type
                  const double& dparam, // event parameter of double type
                  const string& sparam  // event parameter of string type
  )
{
   CEvent* event = NULL;
   switch(id)
   {
      case CHARTEVENT_OBJECT_CLICK:
         event = new CEventChartObjClick(sparam);
         break;
   }
   if(event != NULL)
   {
      Fon.Event(event);
      delete event;
   }
}
Using this method, we have sent the CEventChartObjClick broadcast event, which all elements inside the Fon instance will receive. It depends on the internal logic of the form, whether the event will be processed.
Let's make our MetaQuotes Language label handle this click, and change its text to "Enjoy". To do this, we create the CEnjoy class and provide it with the necessary logic: override the OnClick method, which is the handler of the appropriate event:
//+------------------------------------------------------------------+
//|                                       MarketBookArticlePanel.mq5 |
//|                        Copyright 2015, MetaQuotes Software Corp. |
//|                                             https://www.mql5.com |
//+------------------------------------------------------------------+
#property copyright "Copyright 2015, MetaQuotes Software Corp."
#property link      "https://www.mql5.com"
#property version   "1.00"
#include <Panel\ElChart.mqh>
#include <Panel\Node.mqh>

CElChart Fon(OBJ_RECTANGLE_LABEL);

//+------------------------------------------------------------------+
//| Expert initialization function                                   |
//+------------------------------------------------------------------+
class CEnjoy : public CElChart
{
protected:
   virtual void OnClick(void);
public:
                CEnjoy(void);

};

CEnjoy::CEnjoy(void) : CElChart(OBJ_BUTTON)
{
}
void CEnjoy::OnClick(void)
{
   if(Text() != "Enjoy!")
      Text("Enjoy!");
   else
      Text("MetaQuotes Language");
}
CEnjoy Label;
//+------------------------------------------------------------------+
//| Expert initialization function                                   |
//+------------------------------------------------------------------+
int OnInit()
{
//---
   Fon.Height(100);
   Fon.Width(250);
   Fon.YCoord(200);
   Fon.XCoord(200);
   Fon.BackgroundColor(clrWhite);
   Fon.BorderType(BORDER_FLAT);
   Fon.BorderColor(clrBlack);

   Label.Text("Meta Quotes Language");
   Label.BorderType(BORDER_FLAT);
   Label.BorderColor(clrBlack);
   Label.Width(150);
   Label.YCoord(240);
   Label.XCoord(250);
   //Label.Show();
   Fon.AddElement(&Label);

   Fon.Show();
   ChartRedraw();
//---
   return(INIT_SUCCEEDED);
}
void OnChartEvent(const int id,         // event identifier
                  const long& lparam,   // event parameter of long type
                  const double& dparam, // event parameter of double type
                  const string& sparam  // event parameter of string type
  )
{
   CEvent* event = NULL;
   switch(id)
   {
      case CHARTEVENT_OBJECT_CLICK:
         event = new CEventChartObjClick(sparam);
         break;
   }
   if(event != NULL)
   {
      Fon.Event(event);
      delete event;
   }
   ChartRedraw();
}
//+------------------------------------------------------------------+
//| Expert tick function                                             |
//+------------------------------------------------------------------+
void OnTick()
  {
//---

  }
//+------------------------------------------------------------------+
It may seem strange that we send the CEventObjClick event to the Form via the Event method, and process it in OnClick. Many standard events (for example, mouse clicks) have their own special event methods. If we override them, they will receive the corresponding event. Without overriding, all events will be processed at one level higher, in the Event method. It is also a virtual method and it can be overridden similar to OnClick. At this level, an event is handled through the analysis of the received CEvent instance.
We will not go into detail now. Let's specify the main properties of CPanel.
- All CPanel classes that implement GUI elements can be based on any selected graphic primitive. It is selected and specified during the creation of the class instance.
- An arbitrary CPanel element can contain an unlimited number of other CPanel elements. This is how nesting and control universality are implemented. All events are distributed along the nesting tree, so every element has access to every event.
- The CPanel event model has two levels. The low-level model is based on the Event method and CEvent type classes. This allows handling absolutely any events, even those not supported in MQL. Events sent through CEvent are always broadcast. At a higher level, standard events are converted to calls of appropriate methods. For example, the CEventChartObjClick event is converted to OnClick call, and the Show method call generates a recursive call of OnShow methods for all child elements. A direct event call is possible at this level. For example, if we call Show(), it will display a panel. The call of Refresh will refresh the panel display.
The review turned out to be rather brief and concise, but the general idea should be enough for understanding our further actions that we are going to take while creating a scalping Market Depth tool.
Synchronizing the tick stream with the order book
The order book is a dynamic structure, whose values may change dozens of times per second on volatile markets. To access the current state of the order book, you must handle a special BookEvent in the corresponding event handler, the OnBookEvent function. When the order book changes, the terminal calls OnBookEvent, indicating the symbol corresponding to changes. In the previous article, we developed the CMarketBook class that provided a convenient access to the current order book state. The current state of the order book could be obtained in this class by calling the Refresh() method in the OnBookEvent function. That's how it looked like:
//+------------------------------------------------------------------+
//|                                                   MarketBook.mq5 |
//|                        Copyright 2017, MetaQuotes Software Corp. |
//|                                             https://www.mql5.com |
//+------------------------------------------------------------------+
#property copyright "Copyright 2017, MetaQuotes Software Corp."
#property link      "https://www.mql5.com"
#property version   "1.00"
#property indicator_chart_window
#property indicator_buffers 0
#property indicator_plots 0
#include <MarketBook.mqh>

CMarketBook MarketBook.mqh
double fake_buffer[];
//+------------------------------------------------------------------+
//| Custom indicator initialization function                         |
//+------------------------------------------------------------------+
int OnInit()
  {
   MarketBook.SetMarketBookSymbol(Symbol());
//--- indicator buffers mapping
   SetIndexBuffer(0,fake_buffer,INDICATOR_CALCULATIONS);
//---
   return(INIT_SUCCEEDED);
  }
//+------------------------------------------------------------------+
//| MarketBook change event                                          |
//+------------------------------------------------------------------+
void OnBookEvent(const string &symbol)
{
   if(symbol != MarketBook.GetMarketBookSymbol())
      return;
   MarketBook.Refresh();
   ChartRedraw();
}
In the new version, in addition to the order book the Market Depth should display a real-time tick chart. Therefore we need to implement additional functions for working with newly received ticks. In MQL5, there are three basic mechanisms to analyze ticks. They include:
- Getting the last known tick using the SymbolInfoTick function,
- Handling the arrival of a new tick in the OnTick function for Expert Advisors and in OnCalculate for indicators,
- Obtaining tick history using the CopyTicks and CopyTicksRange functions.
The first two methods can be combined. For example, the SymbolInfoTick function can be called in OnTick or OnCalculate in order to access the last tick parameters. However, these two methods will not work for us because of the specifics of the emergence of the tick flow.
In order to understand how ticks are formed, let's check the article Principles of Exchange Pricing through the Example of Moscow Exchange's Derivatives Market and consider a Market Depth for gold:
| Price, $ per a troy ounce of gold | Number of ounces (Contracts) |
|---|---|
| 1280.8 | 17 |
| 1280.3 | 3 |
| 1280.1 | 5 |
| 1280.0 | 1 |
| 1279.8 | 2 |
| 1279.7 | 15 |
| 1279.3 | 3 |
| 1278.8 | 13 |
Fig. 4. An example of Market Depth.
Suppose that at the time of Market Depth update we request tick history and use a special algorithm to determine how many ticks have arrived since the previous update. Theoretically, every tick must correspond to at least one change in the order book, which means that no more than one tick can arrive with each change of the order book. But it differs in reality, and we need to work with the tick history for a proper synchronization.
Suppose there is a buyer willing to purchase 9 gold contracts. The buyer will execute at least three deals to purchase gold. If there are more buyers willing to buy at 1280.1 or 1280.3, there will be even more deals. By performing one action (purchase), the buyer creates multiple deals that will be performed simultaneously. So, a "pack" of ticks will arrive to the MetaTrader 5 terminal. And if we use the SymbolInfoTick function in OnCalculate, it will only return the last tick from this series, while the previous ticks will be lost.
That is why we need a more reliable mechanism for obtaining ticks using the CopyTicks function. Unlike SymbolInfoTick, this function allows receiving a series of ticks, similar to CopyTicksRange. This provides a correct display of the tick history without losing ticks.
But the CopyTiks function does not allow requesting N last ticks. Instead, it provides all ticks that arrived after the specified time moment. This complicates the task. We need to execute a request, receive an array of ticks and compare it to the array of ticks that we received during the previous update. Thus we can find out what ticks were not included in the previous pack, i.e. what ticks are new. But ticks cannot be compared directly to each other, because there cannot be visible differences between them. For example, refer to the following order book example:
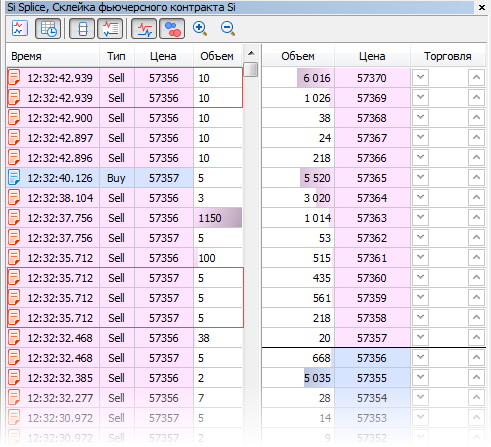
Fig. 5. An order book with an example of identical deals.
We can see two groups of absolutely identical ticks. They are marked with red frames: they have the same time, volume, direction and price. So it's clear that we cannot compare ticks to each other.
But we can compare a group of ticks. If two groups of ticks are equal, then these ticks and further ones have already been analyzed during the previous price update.
Let us synchronize the CMarketBook class with the tick stream: add the MqlTiks array to it, which contains new ticks that were received since the previous update. New ticks will be calculated by the internal CompareTiks method:
//+------------------------------------------------------------------+
//| Compare two ticks collections and find new ticks                 |
//+------------------------------------------------------------------+
void CMarketBook::CompareTiks(void)
{
   MqlTick n_tiks[];
   ulong t_begin = (TimeCurrent()-(1*20))*1000; // from 20 sec ago
   int total = CopyTicks(m_symbol, n_tiks, COPY_TICKS_ALL, t_begin, 1000);
   if(total<1)
   {
      printf("Failed to receive ticks");
      return;
   }
   if(ArraySize(m_ticks) == 0)
   {
      ArrayCopy(m_ticks, n_tiks, 0, 0, WHOLE_ARRAY);
      return;
   }
   int k = ArraySize(m_ticks)-1;
   int n_t = 0;
   int limit_comp = 20;
   int comp_sucess = 0;
   //Go through all received deals starting with the last one
   for(int i = ArraySize(n_tiks)-1; i >= 0 && k >= 0; i--)
   {
      if(!CompareTiks(n_tiks[i], m_ticks[k]))
      {
         n_t = ArraySize(n_tiks) - i;
         k = ArraySize(m_ticks)-1;
         comp_sucess = 0;
      }
      else
      {
         comp_sucess += 1;
         if(comp_sucess >= limit_comp)
            break;
         k--;
      }
   }
   //Remember the received ticks
   ArrayResize(m_ticks, total);
   ArrayCopy(m_ticks, n_tiks, 0, 0, WHOLE_ARRAY);
   //Calculate the index of the beginning of new ticks and copy them to buffer for access
   ArrayResize(LastTicks, n_t);
   if(n_t > 0)
   {
      int index = ArraySize(n_tiks)-n_t;
      ArrayCopy(LastTicks, m_ticks, 0, index, n_t);
   }
}
This algorithm is non-trivial. CompareTicks requests all ticks for the last 20 seconds and compares them to the previous remembered array of ticks starting with the last one. If 20 ticks of the current array are successively equal to 20 ticks of the previous array, it is assumed that all ticks following these 20 ones are new.
Here is a simple scheme explaining this algorithm. Suppose we call the CopyTiks twice with a short interval between calls. Instead of ticks, the function returns an array of zeros and ones. Having obtained these two arrays, we check how many unique last elements there are in the second array, which do not match the elements of the first array. This will be the number of new ticks received since the previous update. That's how it might look like in a scheme:
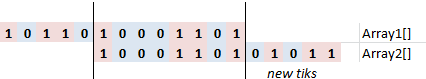
Fig. 6. Repeating series synchronization scheme.
The comparison shows that the numbers from 6 to 14 in the first array are equal to numbers from 1 to 8 in the second array. So Array2 has five new values, i.e. elements from 9 to 14. The algorithm works in different combinations: arrays can have different length, may not have common elements or be absolutely identical. In all these cases, the number of new values will be determined correctly.
Once the number of new ticks is determined, we copy them to the LastTiks array. This array is determined as a public field inside the CMarketBook class.
It is a new version of the CMarketBook class, which, in addition to the order book contains an array of ticks received between the previous and the current update. For example, the following code can be used to find out about new ticks:
//+------------------------------------------------------------------+
//| MarketBook change event                                          |
//+------------------------------------------------------------------+
void OnBookEvent(const string &symbol)
{

   if(symbol != MarketBook.GetMarketBookSymbol())
      return;
   MarketBook.Refresh();
   string new_tiks = (string)ArraySize(MarketBook.LastTicks);
   printf("" + new_tiks + " new ticks have been received");
}
The availability of ticks in the Market Depth class enables a proper synchronization of current orders with the tick stream. At each moment of order book update, we have a list of ticks as of before the update. So, the tick stream and the order book are fully synchronized. We will use this important quality later. Now we move on to the CGraphic graphics library.
CGraphic Basics
The CGraphic library includes lines, histograms, points, and complex geometric shapes. For our purposes, we will only use a small part of its capabilities. We will need two lines to display the Ask and Bid levels, and special points to display Last trades. CGraphic is a container of CCurve objects. As the name suggests, each of these objects is a curve consisting of points with X and Y coordinates. Depending on the display type, they can be connected by lines, can be shown as tops of histogram bars or can be displayed as is, i.e. as points.
Due to Last deal display features, we will work with two-dimensional charts. Let us try to create a simple two-dimensional linear chart:
//+------------------------------------------------------------------+
//|                                                   TestCanvas.mq5 |
//|                                 Copyright 2017, Vasiliy Sokolov. |
//|                                             https://www.mql5.com |
//+------------------------------------------------------------------+
#property copyright "Copyright 2017, Vasiliy Sokolov."
#property link      "https://www.mql5.com"
#property version   "1.00"
#include <Graphics\Graphic.mqh>

CGraphic Graph;
//+------------------------------------------------------------------+
//| Expert initialization function                                   |
//+------------------------------------------------------------------+
int OnInit()
{
   double x[] = {1,2,3,4,5,6,7,8,9,10};
   double y[] = {1,2,3,2,4,3,5,6,4,3};
   CCurve* cur = Graph.CurveAdd(x, y, CURVE_LINES, "Line");
   Graph.CurvePlotAll();
   Graph.Create(ChartID(), "Ticks", 0, (int)50, (int)60, 510, 300);
   Graph.Redraw(true);
   Graph.Update();
   return(INIT_SUCCEEDED);
}
//+------------------------------------------------------------------+
//| Expert tick function                                             |
//+------------------------------------------------------------------+
void OnTick()
  {
//---

  }
//+------------------------------------------------------------------+
If you run it as an Expert Advisor, the following picture will appear on the chart:
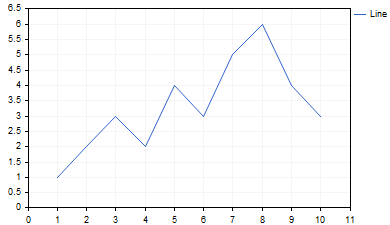
Fig. 7. An example of a two-dimensional linear chart created using CGraphic
Now we'll try to change the representation, for which we change the display type of our two-dimensional CCurve to points:
//+------------------------------------------------------------------+
//| Expert initialization function                                   |
//+------------------------------------------------------------------+
int OnInit()
{
   double x[] = {1,2,3,4,5,6,7,8,9,10};
   double y[] = {1,2,3,2,4,3,5,6,4,3};
   CCurve* cur = Graph.CurveAdd(x, y, CURVE_POINTS, "Points");
   cur.PointsType(POINT_CIRCLE);
   Graph.CurvePlotAll();
   Graph.Create(ChartID(), "Ticks", 0, (int)50, (int)60, 510, 300);
   Graph.Redraw(true);
   Graph.Update();
   return(INIT_SUCCEEDED);
}
The same chart in the form of points looks as follows:
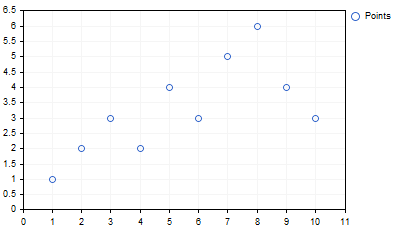
Fig. 8. An example of a two-dimensional point chart created using CGraphic
As you can see, here we create a curve object, the values of which must be contained in the x and y arrays:
double x[] = {1,2,3,4,5,6,7,8,9,10};
double y[] = {1,2,3,2,4,3,5,6,4,3};
CCurve* cur = Graph.CurveAdd(x, y, CURVE_POINTS, "Points");
The created object is located inside CGraphic, and the CurveAdd method returns a reference to it. This allows setting required properties of the curve, which we have done in the second example by setting the curve type to CURVE_POINTS and specifying the point type as a circle:
cur.PointsType(POINT_CIRCLE);
After adding all lines, we need to display the plotting on a chart using the Create and Redraw commands.
We repeat the same sequence of actions in our Market Depth project, but data for the curves will be prepared in a special way and all commands will be placed inside the special CElTickGraph class derived from CElChart.
Integration of CGraphic with the CPanel library
We have discussed the main points of working with CGraphic. Now it is time to add the CPanel library to this class. As already mentioned, CPanel provides access to events, properly arranges graphical elements and manages their properties. All this is necessary to make a tick chart an organic part of a Market Depth panel. Therefore, we first write a special CElTickGraph element, which is a part of CPanel that integrates CGraphic into a panel. In addition, CElTickGraph will receive an updated tick price stream and redraw our tick chart. The last task is the most difficult one. Here is a brief enumeration of what CElTickGraph should be able to do.
- CElTickGraph marks a rectangular area inside the Market Depth panel. The area is marked with a black frame.
- Inside the CElTickGraph area, a CGraphic chart showing the tick price stream is displayed.
- The tick stream shows last N ticks. The N number can be changed in settings.
- CElTickGraph updates the values of CCurve curves that are included in CGraphic, so old ticks are removed from the chart, and new ones are added to it. This allows CElTickGraph to create an effect of a smoothly changing tick chart.
To simplify the task for CElTickGraph, we will use an auxiliary solution: a ring buffer whose operation principle was described in detail in a separate article.
Let us create four ring buffers to display the following values:
- the Ask level (shown as a red line);
- the Bid level (shown as a blue line);
- the last trade from the buy side (shown as a blue triangle pointing down);
- the last trade from the sell side (shown as a red triangle pointing up).
So we will separate buy and sell Last deals, that is why we need two ring buffers.
The second difficulty is connected with the fact that the number of points between Ask/Bid and Last prices are not equal. When we draw a continuous line, there is an Y value for each point along the X axis. If instead of the line points are used, at the X moment a point can be either present on the chart or not. We should take into account this property and use a two-dimensional chart. Suppose we have a point with the following X-Y coordinates: 1000-57034. At the moment of new tick arrival, the same point will have coordinates 999-57034. After five more ticks, it will move to position 994-57034. Its last position will be 0-57034. Then it will disappear from the chart. The next point can be distant from it at a different number of steps. When point 1 has coordinates 994-57034, point 2 will be at 995:57035 or 998:57035. By combining lines on a two-dimensional chart, we can map these gaps correctly, without dumping the tick stream into a continuous queue.
Let's imagine a hypothetical table of ticks, displaying the order book taking into account indexes:
| Index | Ask | Bid | Buy | Sell |
|---|---|---|---|---|
| 999 | 57034 | 57032 | 57034 | |
| 998 | 57034 | 57032 | 57032 | |
| 997 | 57034 | 57031 | 57034 | |
| 996 | 57035 | 57033 | 57035 | |
| 995 | 57036 | 57035 | ||
| 994 | 57036 | 57035 | ||
| 993 | 57036 | 57035 | 57035 | |
| 992 | 57036 | 57034 | 57034 | |
| 991 | 57036 | 57035 | 57035 | |
| ... |
Table 1. The scheme of tick stream synchronization in a two-dimensional table (chart)
Ask and Bid values are all filled in the table, while Buy and Sell deals are sometimes absent. Positioning of values based on indexes correctly synchronizes series of different lengths. No matter how many Last deals we have, they will always correlate with the required Ask and Bid levels.
We have described general principles of CElTickGraph. Below is its full code. After that we will analyze the most difficult parts of it.
//+------------------------------------------------------------------+
//|                                                         Graf.mqh |
//|                        Copyright 2017, MetaQuotes Software Corp. |
//|                                              https://www.mql5.com |
//+------------------------------------------------------------------+
#property copyright "Copyright 2017, MetaQuotes Software Corp."
#property link      "https://www.mql5.com"
#include <Panel\ElChart.mqh>
#include <RingBuffer\RiBuffDbl.mqh>
#include <RingBuffer\RiBuffInt.mqh>
#include <RingBuffer\RiMaxMin.mqh>
#include "GlobalMarketBook.mqh"
#include "GraphicMain.mqh"
#include "EventNewTick.mqh"

input int TicksHistoryTotal = 200;
//+------------------------------------------------------------------+
//| Determines the number of a curve in the CGraphic object          |
//+------------------------------------------------------------------+
enum ENUM_TICK_LINES
{
   ASK_LINE,
   BID_LINE,
   LAST_BUY,
   LAST_SELL,
   LAST_LINE,
   VOL_LINE
};
//+------------------------------------------------------------------+
//| Graphic element displaying the tick chart                        |
//+------------------------------------------------------------------+
class CElTickGraph : public CElChart
{
private:

   CGraphicMain m_graf;
   /* Key buffers for fast operation with the tick stream*/
   CRiMaxMin    m_ask;
   CRiMaxMin    m_bid;
   CRiMaxMin    m_last;
   CRiBuffDbl   m_last_buy;
   CRiMaxMin    m_last_sell;
   CRiBuffInt   m_vol;
   CRiBuffInt   m_flags;

   double       m_xpoints[];  // An array of indexes
   void         RefreshCurves();
   void         SetMaxMin(void);
public:
                CElTickGraph(void);
   virtual void Event(CEvent* event);
   void         SetTiksTotal(int tiks);
   int          GetTiksTotal(void);
   void         Redraw(void);
   virtual void Show(void);
   virtual void OnHide(void);
   virtual void OnRefresh(CEventRefresh* refresh);
   void         AddLastTick();
};
//+------------------------------------------------------------------+
//| Chart initialization                                             |
//+------------------------------------------------------------------+
CElTickGraph::CElTickGraph(void) : CElChart(OBJ_RECTANGLE_LABEL)
{
   double y[] = {0};
   y[0] = MarketBook.InfoGetDouble(MBOOK_BEST_ASK_PRICE);
   double x[] = {0};

   CCurve* cur = m_graf.CurveAdd(x, y, CURVE_LINES, "Ask");
   cur.Color(ColorToARGB(clrLightCoral, 255));
   cur.LinesEndStyle(LINE_END_ROUND);

   cur = m_graf.CurveAdd(x, y, CURVE_LINES, "Bid");
   cur.Color(ColorToARGB(clrCornflowerBlue, 255));

   cur = m_graf.CurveAdd(x, y, CURVE_POINTS, "Buy");
   cur.PointsType(POINT_TRIANGLE_DOWN);
   cur.PointsColor(ColorToARGB(clrCornflowerBlue, 255));
   cur.Color(ColorToARGB(clrCornflowerBlue, 255));
   cur.PointsFill(true);
   cur.PointsSize(5);


   cur = m_graf.CurveAdd(x, y, CURVE_POINTS, "Sell");
   cur.PointsType(POINT_TRIANGLE);
   cur.PointsColor(ColorToARGB(clrLightCoral, 255));
   cur.Color(ColorToARGB(clrLightCoral, 255));
   cur.PointsFill(true);
   cur.PointsSize(5);

   m_graf.CurvePlotAll();
   m_graf.IndentRight(1);
   m_graf.GapSize(1);
   SetTiksTotal(TicksHistoryTotal);
}
//+------------------------------------------------------------------+
//| Sets the number of ticks in t he chart window                    |
//+------------------------------------------------------------------+
void CElTickGraph::SetTiksTotal(int tiks)
{
   m_last.SetMaxTotal(tiks);
   m_last_buy.SetMaxTotal(tiks);
   m_last_sell.SetMaxTotal(tiks);
   m_ask.SetMaxTotal(tiks);
   m_bid.SetMaxTotal(tiks);
   m_vol.SetMaxTotal(tiks);
   ArrayResize(m_xpoints, tiks);
   for(int i = 0; i < ArraySize(m_xpoints); i++)
      m_xpoints[i] = i;
}

//+------------------------------------------------------------------+
//| Updates tick lines                                               |
//+------------------------------------------------------------------+
void CElTickGraph::RefreshCurves(void)
{
   int total_last = m_last.GetTotal();
   int total_ask = m_ask.GetTotal();
   int total_bid = m_bid.GetTotal();
   int total = 10;
   for(int i = 0; i < m_graf.CurvesTotal(); i++)
   {
      CCurve* curve = m_graf.CurveGetByIndex(i);
      double y_points[];
      double x_points[];
      switch(i)
      {
         case LAST_LINE:
         {
            m_last.ToArray(y_points);
            if(ArraySize(x_points) < ArraySize(y_points))
               ArrayCopy(x_points, m_xpoints, 0, 0, ArraySize(y_points));
            curve.Update(x_points, y_points);
            break;
         }
         case ASK_LINE:
            m_ask.ToArray(y_points);
            if(ArraySize(x_points) < ArraySize(y_points))
               ArrayCopy(x_points, m_xpoints, 0, 0, ArraySize(y_points));
            curve.Update(x_points, y_points);
            break;
         case BID_LINE:
            m_bid.ToArray(y_points);
            if(ArraySize(x_points) < ArraySize(y_points))
               ArrayCopy(x_points, m_xpoints, 0, 0, ArraySize(y_points));
            curve.Update(x_points, y_points);
            break;
         case LAST_BUY:
         {
            m_last_buy.ToArray(y_points);
            CPoint2D points[];
            ArrayResize(points, ArraySize(y_points));
            int k = 0;
            for(int p = 0; p < ArraySize(y_points);p++)
            {
               if(y_points[p] == -1)
                  continue;
               points[k].x = p;
               points[k].y = y_points[p];
               k++;
            }
            if(k > 0)
            {
               ArrayResize(points, k);
               curve.Update(points);
            }
            break;
         }
         case LAST_SELL:
         {
            m_last_sell.ToArray(y_points);
            CPoint2D points[];
            ArrayResize(points, ArraySize(y_points));
            int k = 0;
            for(int p = 0; p < ArraySize(y_points);p++)
            {
               if(y_points[p] == -1)
                  continue;
               points[k].x = p;
               points[k].y = y_points[p];
               k++;
            }
            if(k > 0)
            {
               ArrayResize(points, k);
               curve.Update(points);
            }
            break;
         }
      }
   }

}
//+------------------------------------------------------------------+
//| Returns the number of ticks in the chart window                  |
//+------------------------------------------------------------------+
int CElTickGraph::GetTiksTotal(void)
{
   return m_ask.GetMaxTotal();
}
//+------------------------------------------------------------------+
//| Updates the chart during order book update                       |
//+------------------------------------------------------------------+
void CElTickGraph::OnRefresh(CEventRefresh* refresh)
{
   //Draw the last received ticks on the chart
   int dbg = 5;
   int total = ArraySize(MarketBook.LastTicks);
   for(int i = 0; i < ArraySize(MarketBook.LastTicks); i++)
   {
      MqlTick tick = MarketBook.LastTicks[i];
      if((tick.flags & TICK_FLAG_BUY)==TICK_FLAG_BUY)
      {
         m_last_buy.AddValue(tick.last);
         m_last_sell.AddValue(-1);
         m_ask.AddValue(tick.last);
         m_bid.AddValue(tick.bid);
      }
      if((tick.flags & TICK_FLAG_SELL)==TICK_FLAG_SELL)
      {
         m_last_sell.AddValue(tick.last);
         m_last_buy.AddValue(-1);
         m_bid.AddValue(tick.last);
         m_ask.AddValue(tick.ask);
      }
      if((tick.flags & TICK_FLAG_ASK)==TICK_FLAG_ASK ||
         (tick.flags & TICK_FLAG_BID)==TICK_FLAG_BID)
      {
         m_last_sell.AddValue(-1);
         m_last_buy.AddValue(-1);
         m_bid.AddValue(tick.bid);
         m_ask.AddValue(tick.ask);
      }
   }
   MqlTick tick;
   if(!SymbolInfoTick(Symbol(), tick))
       return;
   if(ArraySize(MarketBook.LastTicks)>0)
   {
      RefreshCurves();
      m_graf.Redraw(true);
      m_graf.Update();
   }
}
void CElTickGraph::Event(CEvent *event)
{
   CElChart::Event(event);
   if(event.EventType() != EVENT_CHART_CUSTOM)
      return;
   CEventNewTick* ent = dynamic_cast<CEventNewTick*>(event);
   if(ent == NULL)
      return;
   MqlTick tick;
   ent.GetNewTick(tick);
   if((tick.flags & TICK_FLAG_BUY) == TICK_FLAG_BUY)
   {
      int last = m_last_buy.GetTotal()-1;
      if(last >= 0)
         m_last_buy.ChangeValue(last, tick.last);
   }
}
//+------------------------------------------------------------------+
//| Calculates the scale along axes so that the current price is     |
//| always in the middle of the price chart                          |
//+------------------------------------------------------------------+
void CElTickGraph::SetMaxMin(void)
{
   double max = m_last.MaxValue();
   double min = m_last.MinValue();
   double curr = m_last.GetValue(m_last.GetTotal()-1);
   double max_delta = max - curr;
   double min_delta = curr - min;
   if(max_delta > min_delta)
      m_graf.SetMaxMinValues(0, m_last.GetTotal(), (max-max_delta*2.0), max);
   else
      m_graf.SetMaxMinValues(0, m_last.GetTotal(), min, (min+min_delta*2.0));
}
//+------------------------------------------------------------------+
//| Refreshes the chart                                              |
//+------------------------------------------------------------------+
void CElTickGraph::Redraw(void)
{
   m_graf.Redraw(true);
   m_graf.Update();
}
//+------------------------------------------------------------------+
//| Intercepts chart display and changes display priority            |
//+------------------------------------------------------------------+
void CElTickGraph::Show(void)
{
   BackgroundColor(clrNONE);
   BorderColor(clrBlack);
   Text("Ticks:");
   //m_graf.BackgroundColor(clrWhiteSmoke);
   m_graf.Create(ChartID(), "Ticks", 0, (int)XCoord()+20, (int)YCoord()+30, 610, 600);
   m_graf.Redraw(true);
   m_graf.Update();
   CElChart::Show();
}

//+------------------------------------------------------------------+
//| At the time of display we show the chart                         |
//+------------------------------------------------------------------+
void CElTickGraph::OnHide(void)
{
   m_graf.Destroy();
   CNode::OnHide();
}
Let's analyze this code in detail. We start with the CElTickGraph::CElTickGraph class constructor. It is clear from the constructor declaration that the class is based on the OBJ_RECTANGLE_LABEL graphic primitive, i.e. on a rectangular label. Several CCurve type curves are created in the constructor, each of them is responsible for certain data type. The following properties are set for each curve: line name, type, and color. At the moment of curve creation, it is yet unknown what values it should display, so we use fake arrays double x and y, containing the coordinates of the first point. Once the curves are created and placed in the CGraphic object, ring buffers are configured in the SetTiksTotal method. Configuration here means setting the maximum number of remembered tick, which is set by the TicksHistoryTotal external parameter.
After required curves are added to CGraphic and ring buffers are properly configured, the Market Depth is ready for use. Two main methods are called during Market Depth operation: CElTickGraph::OnRefresh and CElTickGraph::RefreshCurves. Let's have a look at them.
The OnRefresh method is called after a change in the order book. Such changes are tracked using the OnBookEvent function:
//+------------------------------------------------------------------+
//| MarketBook change event                                          |
//+------------------------------------------------------------------+
void OnBookEvent(const string &symbol)
{

   if(symbol != MarketBook.GetMarketBookSymbol())
      return;
   MarketBook.Refresh();
   MButton.Refresh();
   ChartRedraw();
}
First the order book is updated (MarketBook.Refresh()), and then the panel that displays it: MButton.Refresh(). Since the panel is displayed as a button and can be minimized/expanded, then the button is a parent of the entire panel. All events including the refresh request are received via this button. The refresh request passes through all elements inside the button and finally reaches CElTickGraph, which contains the algorithm that refreshed the chart. The algorithm is implemented in the OnRefresh method.
The algorithm receives the number of ticks that have emerged since the previous refresh. Then the value of each tick is added to the appropriate ring buffer. The Ask price of a tick is added to the m_ask ring buffer, Bid is added to m_bid, etc. If the type of the last tick is the Last deal, Ask and Bid are forcedly synchronized with the Last price. This procedure is required because the terminal does not synchronize values and provides Ask and Bid of previous ticks. Thus, Last deals are always either on the Ask or on the Bid level. Note that the standard order book does not produce this synchronization, and the last price can be visually position between these two lines.
Once the last queue of ticks is placed to ring buffers, the OnRefreshCurves method responsible for tick drawing on a chart is called. The method contains a loop which checks all available CCurve curves. A full refresh of points is performed for each of the curves using the curve.Update method. Points for the Y axis are obtained by copying all elements of the ring buffer to a double buffer. Points for the X axes are obtained in a more sophisticated way. For each y point, the x coordinate is changed to x-1. I.e. if the x element is equal to 1000, its value will be changed to 999. This provides the effect of a movement, during which the chart draws new values, while the old ones disappear from it.
After all the values are placed at the desired indexes, and the CCurve curves are updated, we need to refresh the Market Depth. For this purpose, chart refresh methods are called in the OnRefresh method: m_graf.Redraw and m_graf.Update.
The tick chart display algorithm allows choosing from two modes:
- A tick chart can be displayed without binding last prices to the middle of the order book. Chart highs and lows are calculated automatically inside CGraphic.
- A tick chart can be displayed with last prices bound to the middle of the order book. Wherever the high and low are, the current (last) price is always in the middle of the chart.
In the first case, automatic scaling produced by CGraphic is called. In the second case scaling is performed by the SetMaxMin method.
Installation. Performance in dynamics. Comparative characteristics of Market Depth features
All files required for this application can be divided into four groups:
- Files of the CPanel graphics library. Available at MQL5\Include\Panel;
- Files of the MarketBook class. Available at MQL5\Include\Trade;
- Files of ring buffer classes. Available at MQL5\Include\RingBuffer;
- Files of the scalping market depth. Available at MQL5\Indicators\MarketBookArticle.
The attached zip contains the above files in appropriate folders. To install the program, unzip the archive to the MQL5 folder. You do not need to create any additional subfolders. After unzipping, compile the file MQL5\Indicators\MarketBookArticle\MarketBook.mq5. After compilation, an appropriate indicator will be added to the MetaTrader 5 Navigator window.
The best way to evaluate the resulting algorithm is to show tick chart changes in dynamics. The below video shows how the tick chart changes over time, and how the chart window smoothly moves to the right:
The resulting tick chart of our Market Depth greatly differs from the standard Market Depth chart in MetaTrader 5. These differences are presented in the below comparative table:
| The standard MetaTrader 5 Depth of Market | The Market Depth developed in this article |
|---|---|
| Last, Ask and Bid are not interrelated. The Last price can be at levels different from Ask and Bid. | Last, Ask, Bid are synchronized. Last price is always at the level of Ask or Bid. |
| Last prices are shown as circles of different diameters which are directly proportional to the deal volume. A circle with the maximum diameter corresponds to a deal with the maximum volume performed for the last N ticks, where N is the period of the moving tick chart window. | Buy deals are shown as blue downward triangles, sell deals are as red upward triangles. Deals are not highlighted based on their volume. |
| The tick chart scale is synchronized with the height of the table of pending orders. Thus, any level in the order book corresponds to the same level on the tick chart. The downside of this solution is that it is not possible to display a tick chart with a larger scale. The advantage is the visibility of prices and full correspondence of order book levels with the tick chart. | Tick chart scale and order table scale do not match. The current price of the tick chart can only approximate the middle of the order book. The downside of this solution is the lack of visual correspondence of the order book levels with the tick chart. The advantage is the possibility to set any desired scale for the tick chart. |
| The tick chart is equipped with an additional histogram of volumes. | The tick chart does not have any additions. |
Table 2. Comparative characteristics of the standard and the newly developed Market Depth.
Conclusion
We have discussed the process of scalping Market Depth development.
- We have improved the appearance of the order book
- We have added to the panel a tick chart based on CGraphic and upgraded the graphical engine
- We have improved the Market Depth class and have implemented an algorithm for synchronizing ticks with the current order book.
However, even the current version of Market Depth is very far from a full-fledged scalping version. Of course, many users could be disappointed, having read the article up to this place and not seeing a full analog of a standard Market Depth or specialized programs like Bondar drive or QScalp. But any complex software product must go through a number of evolutionary steps in its development. Here's what can be added to the Market Depth in further versions:
- The ability to send limit orders straight from the Market Depth
- The ability to track large orders on the tick chart
- Differentiation of Last deals by volume and displaying them in different ways on the chart
- Displaying additional indicators with the tick chart. For example, below the tick chart we can display a histogram of the ratio of all Buy Limit orders to all Sell Limit orders.
- And, finally, the most important part is to download and save the Market Depth history, and to be able to create trading strategies with the offline testing mode.
All these ideas can be implemented. Probably such options will appear some day. If readers find this subject interesting, the series of articles will be continued.