Learn how to design a trading system by Williams PR
Mohamed Abdelmaaboud | 5 July, 2022
Introduction
In this new article from our series about how to design a trading system based on the most popular technical indicators, we will learn how to design different simple trading systems based on a new technical indicator which is the Williams Percent Range (WPR). In addition to understanding the Williams Percent Range technical indicator in detail to learn how we can use it effectively based on the main idea behind it. I believe that If we can understand the root of things, we will not only be able to use it effectively but also we can find new insights or ideas around the main concept or any related tool which can be a reason to get exceptional and better results from trading. So, I have an approach to try learning and teaching the root of things to deepen our understanding more and more.
We will learn that through many topics in this article the same as the following:
- Williams' %R definition
- Williams' %R strategy
- Williams' %R strategy blueprint
- Williams' %R trading system
- Conclusion
Through the first topic which is Williams' %R definition, we will learn what is Williams' %R, what it measures, and how we can calculate it manually. Then we will learn how can we use this indicator properly through simple strategies based on the main concept behind this indicator, we will learn that through the topic of Williams' %R strategy. We will design a step-by-step blueprint for each mentioned strategy to help us to create the main task in this article which is creating a trading system by this indicator. This blueprint will be done through the topic of Williams' %R strategy blueprint. Then, we will come to the most interesting topic in this article is to create a trading system based on mentioned strategies through the topic of Williams' %R trading system.
After these mentioned topics, I think that we will learn the fundamentals of this technical indicator in addition to learning how we create a simple trading system based on it to be able to use this trading system in the MetaTrader 5 to generate signals automatically. I encourage you to apply everything by yourself as this will be very helpful to understand deeply. I confirm also to test every signal strategy before using it on your real account to make sure that it will be useful for you.
We will use the MetaTrader 5 trading terminal and the built-in MetaEditor to write our MQL5 codes to create our trading system in a form of expert advisors. If you do not know how to get the MetaTrader 5 or how to write your MQL5 codes, you can read Writing MQL5 code in MetaEditor topic from a previous article to know more about that.
Disclaimer: All information provided 'as is' only for educational purposes and is not prepared for trading purposes or advice. The information does not guarantee any kind of result. If you choose to use these materials on any of your trading accounts, you will do that at your own risk and you will be the only responsible.
Now, let us start learning a new tool that may be a transition point in our trading journey to get better results.
Williams' %R definition
Same as I mentioned in the introduction we will learn about the Williams' %R indicator in detail. The Williams' %R (WPR) is a momentum indicator that is developed by Larry Williams. We can say that WPR is the opposite of the Stochastic Oscillator as the difference between them is how they are scaled, we can say also that the WPR can be used the same as the Stochastic also. If you want to learn more about the Stochastic indicator, you can read my previous article about Learn how to design a trading system by Stochastic. The WPR measures the relationship between the closing price and the high-low range. The WPR indicator also oscillates between 0 and -100. Because the WPR is a momentum indicator, it may be used to measure the strength of the trend also. If you need to know more about the trend and types of trends, you can read the trend definition topic from a previous article as it may be helpful to understand that. The indicator can be meaningful by watching important levels of -80, -20, and the mid-point -50.
It is important to try to combine another technical tool with this indicator for example price action tools, chart patterns, volume, and moving average like what we will do through this article on the strategies topic as this will be very useful as you will be able to clarify more perspective in the instrument that you study and this will be useful to take the suitable decisions.
Now, we need to know how we can calculate the WPR indicator. Simply, we can calculate it by the following steps:
- Calculate the highest high = the highest value of highs in the calculated period.
- Calculate the lowest low = the lowest value of low in the calculated period.
- WPR = (highest high - close)/(highest high - lowest low) * -100
For more understanding we need to see an example with real values to apply that and calculate the WPR, So, if we have the following data for an instrument.
| Period | High | Low | Close |
|---|---|---|---|
| 1 | 1.078 | 1.0678 | 1.0733 |
| 2 | 1.0788 | 1.0726 | 1.0777 |
| 3 | 1.0766 | 1.0697 | 1.0727 |
| 4 | 1.0733 | 1.0662 | 1.0724 |
| 5 | 1.074 | 1.0642 | 1.068 |
| 6 | 1.0749 | 1.0661 | 1.0734 |
| 7 | 1.0698 | 1.0558 | 1.0689 |
| 8 | 1.0599 | 1.0532 | 1.056 |
| 9 | 1.0608 | 1.046 | 1.0586 |
| 10 | 1.0565 | 1.046 | 1.0466 |
| 11 | 1.0556 | 1.0429 | 1.0547 |
| 12 | 1.0444 | 1.0388 | 1.0431 |
| 13 | 1.0421 | 1.035 | 1.0411 |
| 14 | 1.053 | 1.0353 | 1.0379 |
| 15 | 1.0577 | 1.0502 | 1.0511 |
| 16 | 1.0586 | 1.0525 | 1.0527 |
| 17 | 1.0594 | 1.0495 | 1.0555 |
| 18 | 1.0601 | 1.0482 | 1.0551 |
| 19 | 1.0642 | 1.0493 | 1.054 |
| 20 | 1.0632 | 1.0505 | 1.0621 |
| 21 | 1.0579 | 1.0491 | 1.052 |
| 22 | 1.0567 | 1.0491 | 1.051 |
| 23 | 1.0602 | 1.0381 | 1.0547 |
| 24 | 1.0509 | 1.0359 | 1.0443 |
| 25 | 1.0486 | 1.0396 | 1.0414 |
| 26 | 1.052 | 1.04 | 1.0408 |
| 27 | 1.0644 | 1.0505 | 1.0515 |
| 28 | 1.0775 | 1.0611 | 1.0614 |
| 29 | 1.0749 | 1.0671 | 1.0714 |
| 30 | 1.0715 | 1.0652 | 1.0699 |
Now, we will go through calculation steps to get the WPR the same as the following. Note that, we will use the default settings of the period is 14.
1- Getting highest high.

2- Getting lowest low.

3- Getting WPR.
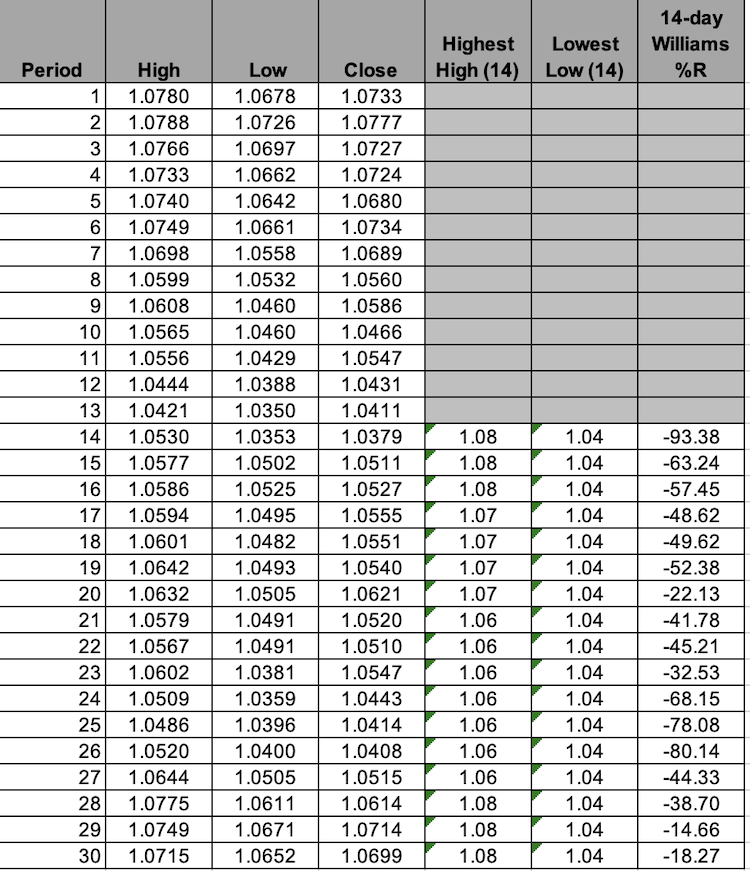
Now, we calculated the WPR values. It will be a line that oscillates between 0 and -100 to measure the momentum the same as we mentioned. Nowadays, we do not need to calculate it manually as we can find it ready in the MetaTrader 5 trading terminal and all we need to do is to choose it among the available indicators the same as the following steps.

After that, we will find its window to determine its parameters the same as the following:

1- To set the desired period.
2- To determine the color of the WPR line.
3- To determine the style of the WPR line.
4- To determine the thickness of the WPR line.
We can also control levels of the indicator through the Levels tab the same as the following:

We can see in the previous picture we have two levels -80 and -20 which are important levels to record high and low readings. Also, we can add other levels as per what we may find that will be useful like adding a -50 level for example by pressing Add and then determining the level to appear on the indicator window on the chart.
After determining all desired parameters and pressing "OK", the indicator will be attached to the chart the same as the following.

As we can see in the previous picture, the black line in the lower window in the chart is oscillating between 0 and -100 to measure the momentum. Also, the mid-point of -50 is an important level and it has meaningful insights into the price movement as when the WPR crosses above the -50 level, this means that the price trades in the upper half part of the high-low range during the calculated period and vice versa when the WPR crosses below -50 level, this means that the price trades in the lower half part of the high-low range in the calculated period. Otherwise, when we see the indicator below the area of -80 this means a low reading which indicates that the price trades near its low but when we see the indicator above the area of -20 level this means a high reading which indicates that the price trades near its high. these levels of -80 and -20 are very important areas because they indicate that prices reach overbought and oversold areas the same as we will see later.
Williams' %R strategy
In this part, we will learn how we can use the Williams' %R through simple strategies based on the main concept of the indicator. We will learn three different strategies which can be used based on the idea behind the Williams %R indicator. The first strategy, we will call it Williams %R - OB and OS, the second one, we can call it Williams %R - crossover, and the third one we will call it Williams %R - MA. in the following lines we will identify how these strategies can be used.
- Strategy one: Williams %R - OB and OS:
According to this strategy, we need to be notified when the instrument is in the overbought area or the oversold area based on a specific condition. When Williams %R value is lower than the -80 level this will be an oversold signal. When the Williams %R value is greater than the -20 level this will be an overbought signal.
This strategy will be helpful to notify us when prices reach overbought or oversold areas and this will help us to expect the upcoming movement by reading the status of momentum.
WPR value < -80 --> oversold
WPR value > - 20 --> overbought
- Strategy two: Williams %R - crossover:
According to this strategy, we need to get a signal when there is a buy or sell signal based on the crossover between the current Williams %R, the previous Williams %R (WPR), and the -50 level. When the previous WPR is lower than - 50 and the current WPR is greater than -50, this will be a buy signal. When the previous WPR is greater than -50 and the current WPR is lower than -50, this will be a sell signal.
This strategy will be useful as it will generate buy and sell signals based on the crossover with a very important level which is -50, and it will be more effective if we combine another technical tool to confirm these signals.
Prev. WPR < -50 and current WPR > -50 --> buy signal
Prev. WPR > -50 and current WPR < -50 --> sell signal
- Strategy three: Williams %R - MA:
According to this strategy, we need to get a notification when we have a buy or sell signal also but it will be based on another condition as we need to get a buy signal when the ask is greater than the moving average value and the Williams %R value is greater than -50 level. We need to get a sell signal when the bid is lower than the moving average value and the Williams %R value is lower than the moving average value.
This strategy allows us to get more defined buy and sell signals based on its conditions because here we combined another technical tool which is the moving average to confirm the current signal and filter false breakouts.
Ask > MA value and WPR > -50 --> buy signal
Bid < MA value and WPR < -50 --> sell signal
Williams' %R strategy blueprint
In this topic, we will design a step-by-step blueprint to create a trading system for every mentioned strategy. I consider this step a very important step in any trading system creation process as it will help us to understand what we need to do through organized steps.
- Strategy one: Williams %R - OB and OS:
Based on this strategy, we will design a step-by-step blueprint to create a trading system as we need the program or expert to check three values every tick and make a comparison to determine the position of one of these values compared to others and these three values are the current WPR , -80, and -20 level. The expert will decide after the previous comparison if the current WPR value is lower than the -80 level we need the expert to generate a comment on the chart with "Over Sold". In the other scenario, when the current WPR value is greater than the -20 level, we need the expert to generate a different comment on the chart with "Over Bought".
The following is the blueprint for this strategy:

- Strategy two: Williams %R - crossover:
Based on this strategy, we need the program to generate buy or sell signals based on checking three values the previous WPR, current WPR, and -50. This signal will be generated based on a comparison after every tick checking by the expert for these three values to determine the position of the previous and current WPR value from the -50 level. We the expert according to what we mentioned to generate a buy signal, the Williams %R value, and the Williams %R previous value as a comment on the chart if the previous WPR is lower than the -50 and the current WPR value is greater than the -50 level. The other sell signal, the Williams %R value, and the previous Williams %R value as a comment on the chart if the previous WPR is greater than -50 and the current WPR is lower than -50.
The following is the blueprint for this strategy as a diagram.

- Strategy three: Williams %R and MA:
We need to create a trading system according to this strategy to generate buy or sell signals based on other conditions or other measurements. As we need to create a simple expert advisor that can be able to generate these signals based on continuously checking for the Ask, Bid, WPR value, moving average, and -50 level. When the expert finds that the Ask price is greater than the moving average and the WPR value is greater than the -50 level, we need the expert to generate a buy signal, Williams %R value, and the exponential moving average value as a comment on the chart. The other case to generate a sell signal, Williams %R value, and the exponential moving average value as a comment also on the chart when the Bid price is lower than the moving average and the WPR is lower than the -50 level.
The following is for the diagram blueprint to create this kind of trading system.

Williams' %R trading system
In this part, we will learn how to create a trading system for each mentioned strategy which is the most interesting part of this article. First, we will create a simple trading system that is generating a comment on the chart by the Williams' %R value to use it as a base for all strategies.
The following is for how to write the code of this trading system:
- Create an array by using the "double" function which represents values with fractions.
double WPArray[]; - Sorting this created array from current data by using the "ArraySetAsSeries" function which returns true or false as it returns a boolean value. Parameters of this function are an array[] and flag.
ArraySetAsSeries(WPArray,true);
- Defining the Williams' %R properties by using the "iWPR" after creating an integer variable for WPDef of Williams' %R definition. the "iWPR" function returns the handle of the Larry Williams' Percent Range indicator. Parameters are symbol name, period, and averaging period.
- We will use (_Symbol) to be applied on the currently used symbol and (_Period) to be applied on the currently used timeframe.
int WPDef = iWPR(_Symbol,_Period,14);
- Copying price data to the created array by using the "CopyBuffer" function which returns the copied data count or -1 if there is an error. Parameters are indicator handle, indicator buffer time, start position, amount to copy, and target array to copy.
CopyBuffer(WPDef,0,0,3,WPArray);
- Getting the Williams' %R value of the current data by using the "NormalizeDouble" function after creating a double variable of WPValue for the current Williams' %R value. Parameters of the "NormalizeDouble" function are the normalized number and the number of digits after the decimal point.
double WPVal = NormalizeDouble(WPArray[0],2);
- Using the "Comment" function to generate the Williams' %R value as a comment on the chart.
Comment("Williams' %R Value is",WPVal);
To see the full code lines consequently of the previous trading system, we can see that through the following full code:
//+------------------------------------------------------------------+
//|                                            Simple Williams%R.mq5 |
//|                                  Copyright 2022, MetaQuotes Ltd. |
//|                                             https://www.mql5.com |
//+------------------------------------------------------------------+
#property copyright "Copyright 2022, MetaQuotes Ltd."
#property link      "https://www.mql5.com"
#property version   "1.00"
//+------------------------------------------------------------------+
void OnTick()
  {
   double WPArray[];

   ArraySetAsSeries(WPArray,true);

   int WPDef = iWPR(_Symbol,_Period,14);

   CopyBuffer(WPDef,0,0,3,WPArray);

   double WPVal = NormalizeDouble(WPArray[0],2);

   Comment("Williams' %R Value is",WPVal);

  }
//+------------------------------------------------------------------+
After compiling this code we can find the expert in the "Expert Advisors" folder file in the Navigator window the same as the following picture.

By dragging and dropping on the desired chart to execute it, the window of this trading system will appear as follows.

After pressing "OK", it will be attached to the chart as follows.

The following is an example of generated signals of this trading system from testing.

As we can see in the previous example, the expert generated a comment signal on the upper left corner of the chart with the current WPR value. To make sure that generated signal is the same as the built-in indicator in MetaTrader 5, we can see that in the following picture.

As we can see in the previous picture that the expert is attached and the indicator is inserted and both of them generated the same signal or value. In the upper right corner when can the Simple Williams %R expert is attached and in the upper left corner, we can find its generated signal as a comment which is equal to -78.15 which is the same as the value of the built-in indicator which is inserted to the chart in the lower window and appear the same value above the WPR line on the left side.
- Strategy one: Williams%R - OB & OS:
Based on this strategy, we need to create a trading system that can be able to generate signals for us to inform us automatically when the price reached overbought or oversold areas. The following is the full code to create a trading system for this strategy:
//+------------------------------------------------------------------+
//|                                         Williams%R - OB & OS.mq5 |
//|                                  Copyright 2022, MetaQuotes Ltd. |
//|                                             https://www.mql5.com |
//+------------------------------------------------------------------+
#property copyright "Copyright 2022, MetaQuotes Ltd."
#property link      "https://www.mql5.com"
#property version   "1.00"
//+------------------------------------------------------------------+
void OnTick()
  {
   double WPArray[];

   ArraySetAsSeries(WPArray,true);

   int WPDef = iWPR(_Symbol,_Period,14);

   CopyBuffer(WPDef,0,0,3,WPArray);

   double WPVal = NormalizeDouble(WPArray[0],2);

   if(WPVal<-80)
   {
      Comment("Over Sold");
   }

   if(WPVal>-20)
   {
      Comment("Over Bought");
   }

  }
//+------------------------------------------------------------------+
Differences in this code are the same as the following.
Conditions of oversold:
   if(WPVal<-80)
   {
      Comment("Over Sold");
   }
Conditions of overbought:
   if(WPVal>-20)
   {
      Comment("Over Bought");
   }
After compiling this code, when we want to execute it in the MetaTrader 5 to generate automatic signals we will do the following step:
Find the expert file in the navigator window.

Drag and drop it on the desired chart that we need to extract signals from. The following is for its window.

Tick next to "Allow Algo Trading" --> Press "OK". Find it attached to the chart.

The following is an example of generating signals based on this strategy from testing.
Overbought:

As we can see in the previous example, the expert generated an over-bought signal as the WPR value is above the -20 level which means that prices are trading near to their high during the 14 periods.
Oversold:

According to the previous example, we found that the WPR is below the -80 level which means that prices are trading near to their lows, So, the signal here is oversold.
- Strategy two: Williams%R - Crossover:
According to this strategy, we need to create a trading system to generate both of buying and selling signals based on the crossover. The following is for the full code to create a trading system based on this strategy:
//+------------------------------------------------------------------+
//|                                       Williams%R - Crossover.mq5 |
//|                                  Copyright 2022, MetaQuotes Ltd. |
//|                                             https://www.mql5.com |
//+------------------------------------------------------------------+
#property copyright "Copyright 2022, MetaQuotes Ltd."
#property link      "https://www.mql5.com"
#property version   "1.00"
//+------------------------------------------------------------------+
void OnTick()
  {
   double WPArray[];

   ArraySetAsSeries(WPArray,true);

   int WPDef = iWPR(_Symbol,_Period,14);

   CopyBuffer(WPDef,0,0,3,WPArray);

   double WPVal = NormalizeDouble(WPArray[0],2);
   double WPPrevVal = NormalizeDouble(WPArray[1],2);

   if(WPPrevVal<-50 && WPVal>-50)
     {
      Comment("Buy signal","\n",
              "Williams % R Value is",WPVal,"\n",
              "Williams % R Previous Value is",WPPrevVal);
     }

   if(WPPrevVal>-50 && WPVal<-50)
     {
      Comment("Sell signal","\n",
              "Williams % R Value is",WPVal,"\n",
              "Williams % R Previous Value is",WPPrevVal);
     }

  }
//+------------------------------------------------------------------+
Differences in this code are the same as the following.
Getting the previous Williams' %R value by using the "NormalizeDouble" function after creating a double variable of WPPrevValue for the previous Williams' %R value. Parameters of the "NormalizeDouble" function are the normalized number and number of digits after the decimal point.
double WPPrevVal = NormalizeDouble(WPArray[1],2);
Conditions of the Williams%R - crossover strategy.
In case of the buy signal:
   if(WPPrevVal<-50 && WPVal>-50)
     {
      Comment("Buy signal","\n",
              "Williams % R Value is",WPVal,"\n",
              "Williams % R Previous Value is",WPPrevVal);
     }
In case of the sell signal:
   if(WPPrevVal>-50 && WPVal<-50)
     {
      Comment("Sell signal","\n",
              "Williams % R Value is",WPVal,"\n",
              "Williams % R Previous Value is",WPPrevVal);
     }
After compiling this code, we can find it in the navigator window the same as the following.

By double-clicking on the expert of this strategy as a second option to execute it on the desired chart, the window of the expert will appear.

After pressing "OK", it will be attached to the chart.

The following is for an example of generated signals of this strategy from testing.
Buy signal:

The same as we can see on the chart, the expert generated a buy signal, the Williams %R value, and the Williams %R value in the upper left corner of the chart as a comment because the conditions of this strategy are met because the previous WPR = -55.93 which is lower than the -50 level and the current WPR = -41.09 which is greater than -50 level.
Sell signal:

As we can see in the previous example of a sell signal based on this strategy, we can find in the upper left corner of the chart the sell signal, the current WPR, and the previous WPR values as a comment because of the conditions of this strategy are met.
The previous WPR value = -29.95 which is greater than the -50 level and the current WPR = -58.8 which is lower than the -50 level.
- Strategy three: Williams%R & MA:
The following is for the full code to create a trading system for this strategy:
//+------------------------------------------------------------------+
//|                                              Williams%R & MA.mq5 |
//|                                  Copyright 2022, MetaQuotes Ltd. |
//|                                             https://www.mql5.com |
//+------------------------------------------------------------------+
#property copyright "Copyright 2022, MetaQuotes Ltd."
#property link      "https://www.mql5.com"
#property version   "1.00"
//+------------------------------------------------------------------+
void OnTick()
  {
   double WPArray[];
   double MAArray[];

   double Ask = NormalizeDouble(SymbolInfoDouble(_Symbol,SYMBOL_ASK),_Digits);
   double Bid = NormalizeDouble(SymbolInfoDouble(_Symbol,SYMBOL_BID),_Digits);

   ArraySetAsSeries(WPArray,true);
   ArraySetAsSeries(MAArray,true);

   int WPDef = iWPR(_Symbol,_Period,14);
   int MADef = iMA(_Symbol,_Period,100,0,MODE_EMA,PRICE_CLOSE);

   CopyBuffer(WPDef,0,0,3,WPArray);
   CopyBuffer(MADef,0,0,3,MAArray);

   double WPVal = NormalizeDouble(WPArray[0],2);
   double MAVal = NormalizeDouble(MAArray[0],2);

   if(Ask>MAVal && WPVal>-50)
     {
      Comment("Buy signal","\n",
              "Williams % R Value is",WPVal,"\n",
              "EMA Value is",MAVal);
     }

   if(Bid<MAVal && WPVal<-50)
     {
      Comment("Sell signal","\n",
              "Williams % R Value is",WPVal,"\n",
              "EMA Value is",MAVal);
     }

  }
//+------------------------------------------------------------------+
Differences in this code are the same as the following.
Creating arrays for WP and MA.
double WPArray[];
double MAArray[];
Getting values of ask and bid after creating double variables for them.
double Ask = NormalizeDouble(SymbolInfoDouble(_Symbol,SYMBOL_ASK),_Digits);
double Bid = NormalizeDouble(SymbolInfoDouble(_Symbol,SYMBOL_BID),_Digits);
Sorting this created arrays from current data.
ArraySetAsSeries(WPArray,true);
ArraySetAsSeries(MAArray,true);
Defining Williams' PR by using the iWPR function and Moving Average by using the iMA function. Parameters of iWPR mentioned before. Parameters of iMA are symbol name, period, averaging period, horizontal shift, smoothing type, and type of price.
int WPDef = iWPR(_Symbol,_Period,14);
int MADef = iMA(_Symbol,_Period,100,0,MODE_EMA,PRICE_CLOSE);
Copying price data to the created arrays by using the "CopyBuffer" function.
CopyBuffer(WPDef,0,0,3,WPArray);
CopyBuffer(MADef,0,0,3,MAArray);
Getting values of the current Williams RP and Moving average.
double WPVal = NormalizeDouble(WPArray[0],2);
double MAVal = NormalizeDouble(MAArray[0],2);
Conditions of strategy.
In case of buy signal:
   if(Ask>MAVal && WPVal>-50)
     {
      Comment("Buy signal","\n",
              "Williams % R Value is",WPVal,"\n",
              "EMA Value is",MAVal);
     }
In case of sell signal
   if(Bid<MAVal && WPVal<-50)
     {
      Comment("Sell signal","\n",
              "Williams % R Value is",WPVal,"\n",
              "EMA Value is",MAVal);
     }
After compiling this code, we will find the expert in the navigator window of the MetaTrader 5 the same as the following.

By dragging and dropping it on the desired chart, we will find its window the same as the following.

After ticking next to "Allow Algo Trading" and then pressing "OK", the expert will be attached to the chart the same as the following.

The following is an example of generated signals based on this strategy.
In case of buy signal:

As we can find on the chart the generated signal in the upper left corner,
- Buy signal
- WPR value
- EMA value
Conditions are met. the Ask is greater than MA and WPR is greater than -50
In case of sell signal:

As we can find on the chart the generated signal in the upper left corner,
- Sell signal
- WPR value
- EMA value
Conditions are met. The bid is lower than MA and WPR is lower than the -50 level.
Conclusion
Williams' PR is an important technical tool that can be considered as one of the most popular indicators that measure the momentum the same as we mentioned. It can be combined also with another technical indicator to magnify benefits because this is one of the most important benefits of technical analysis is that we can use more than one tool which can clear more than one perspective to understand the instrument well to take a suitable decision.
We learned through this article more topics about the Williams' PR technical indicator, as we learned what it is, what it measures, and how we can calculate it by applying that through an example to deepen our understanding, then we learned how we can insert the indicator, and how we can read it to understand what it wants to inform us.
We learned also, how we can use it through simple strategies based on the main concept behind it as we learned three simple strategies and they were:
- Williams %R - OB and OS: to generate signals of overbought and oversold when prices reach these zones.
- Williams %R - crossover: to generate signals of buy and sell signals based on specific and meaningful conditions.
- Williams %R - MA: to generate buy and sell signals based on WPR and exponential moving average reading.
All that we learned in this article is a simple example of how we can do using programming as the Algorithmic trading is an incredible tool that can help us to trade smoothly, easily, and effectively. It can be a very useful tool to let money works for you while sleeping literally. So, I encourage everyone to learn or think about how he can benefit from this tool in a way that increases the probability of maximizing profits.
I need to confirm here again that you must test any strategy before using it on your real account because there is nothing that is suitable for everyone, what is suitable for me may not be for you. especially since the main purpose of this article is educational so we may find that strategies need optimization. I hope that you tried to apply what read by yourself as this will be an important factor to understand what you learn. I hope also that you find this article useful for you to enhance your trading to get better results and if you want to read similar articles about how to design a trading system by the most popular technical indicators, you can read my previous articles in this series and I hope that you find them useful for you.