Developing a trading Expert Advisor from scratch (Part 13): Time and Trade (II)
Daniel Jose | 4 July, 2022
Introduction
In the previous article "Times & Trade (I)" we discussed an alternative chart organization system, which is a prerequisite for creating an indicator enabling the quickest possible interpretation of deals executed in the market. But we have not completed this system: it still lacks the ability to show how you can access certain information, and such access would help to better understand what is happening. Such information cannot be presented directly on the chart. Actually, such presentation could be implemented, however the interpretation would be very confusing. Therefore, it is best to have the data represented in a classical way, i.e. values in text format. Our Expert Advisor does not have a system capable of performing this task. So, we need to implement it.
In order not to complicate the previous article by adding information that some readers may not need at all (as the system can be used without diving deep into such details), I decided to expand the system here and make it more complete, but I didn't include some of the things into the system that was proposed in the previous article. But this information may sometimes be necessary to understand what is actually happening in the market.
Planning
It is important here to understand one thing. It's just details, but as saying goes the devil lives in the details. So, please have a look at the following image:
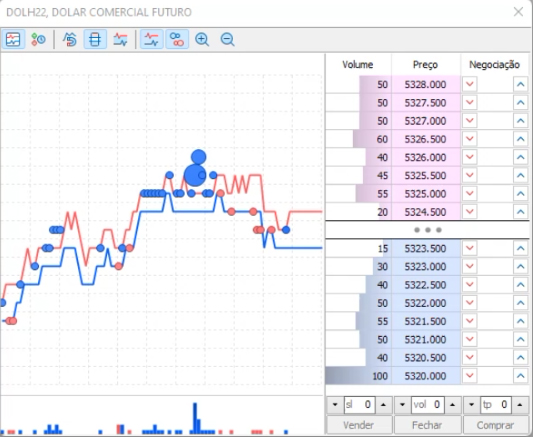
Do you notice anything strange in this image? Something that might not make much sense, but it is here, so look very closely.
If you still haven't noticed anything strange, see the highlighted area below.
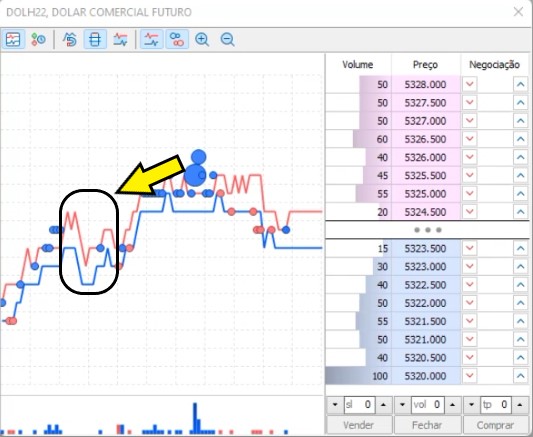
No do you see what is happening? There were changes in the BID and ASK values at this point, but only one trade was performed here. Even if there were changes in the BID Or ASK value, it still makes no sense to have only one trade. But such things are actually more common than you might think. The problem is that such thing usually cannot be seen when you use the reading mode shown below:
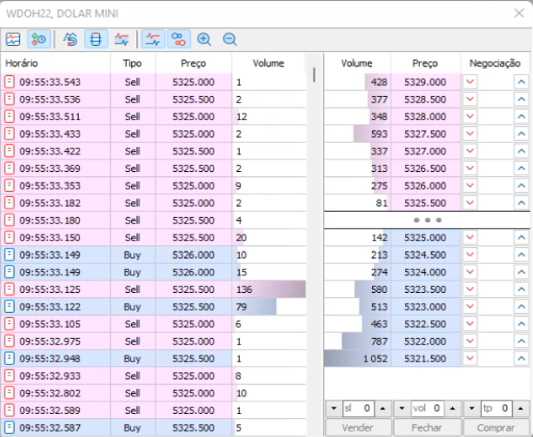
When using this market analyzing method, we cannot see the movement of BID and ASK values. It seems that the market is always working, that everyone is trying to close the deal, but this is not true. Actually, market players place positions at certain points and wait for the market movement. When the position is hit, they try to take advantage and to profit from the move — because of this, the BID or ASK values move without any trades. This is a real fact that can be seen in the platform, which is however ignored by most people who believe that this information is not very important.
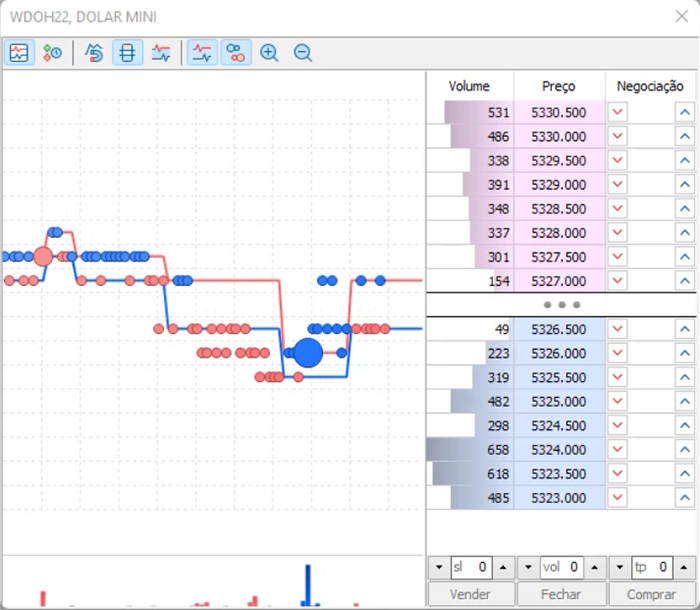
The figure below shows how our Times & Trade system will look like:

If you look closely, you will see that there are four candlestick configurations on the chart. There should be five of them, but direct orders are excluded from the system because they do not actually move the market. Therefore, we actually have four configurations. These are the following formations:


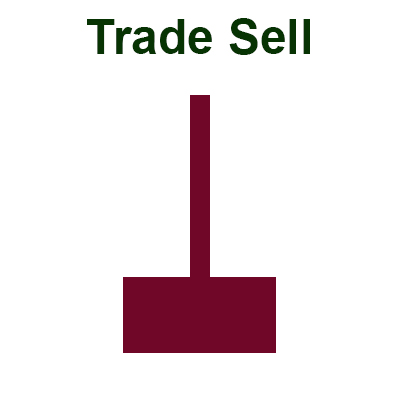

The shadow sometimes does not touch the body of the candlestick. Why is this happening? The shadow is formed by the value of the spread, which in turn is the difference between BID and ASK, but if an operation takes place within this spread, then what the candlestick will look like? This will be the fifth type shown below:

According to the formation type it is DOJI. This is the reason why direct orders are not shown in the system. But it does not explain why the body sometimes does not touch the shadow. Such behavior is connected with situations when something happens that causes the price to move too quickly, do to which there is a distance between the body and the shadow. One might think that this is a system failure, because it makes no sense for the price to do this. But here it does make sense, as this happens exactly when stop orders are triggered. To see this, take a look at the image below:
There is a series of cases when there are orders but neither BID nor Ask is touched. All these points represent triggered stop orders. When this happens, the price usually jumps, which can be seen on the chart. The same fact can be visible on Times & Trade only if you are using the chart mode to evaluate the movement. Without this, you do not see the triggering of stops and may think that the movement has gained strength while actually it can get back quickly, and you will be hit by the stop.
Now that you know this, you will understand that a big series of candlesticks not touching the shadow represents triggered stop orders. In fact, it is impossible to capture this movement exactly when it occurs, since everything happens very quickly. But you can use the interpretation of the BID and ASK values to find out why this happened. This is up to you and your market experience. I won't go into details, but this is something that you should focus on if you really want to use Tape Reading as an indicator.
Now comes the detail: if this information can only be seen using candlesticks and they themselves are enough to learn some information, then why is it so necessary to have more data?
The great detail is that there are times when the market is slower, waiting for some information that can come out at the moment, but we can't know this by simply looking at the Times & Trade with candlesticks. We need something more than that. This information exists in the system itself, but it is difficult to interpret it as it comes. Data should be modeled so that it can be easier analyzed.
This modeling is the reason for writing this article: after this modeling is done, Times & Trade will change to look like this:
In other words, we will have a complete picture of what is happening. Furthermore, everything will be fast, which is important for those who want to use tape reading as a way to trade.
Implementation
To implement the system, we need to add several new variables to the C_TimesAndTrade class. They are shown in the code below:
#include <NanoEA-SIMD\Auxiliar\C_FnSubWin.mqh>
#include <NanoEA-SIMD\Auxiliar\C_Canvas.mqh>
//+------------------------------------------------------------------+
class C_TimesAndTrade : private C_FnSubWin
{
//+------------------------------------------------------------------+
#define def_SizeBuff
2048
#define macro_Limits(A) (A & 0xFF)
#define def_MaxInfos 257
//+------------------------------------------------------------------+
        private :
                string          m_szCustomSymbol,
                                m_szObjName;
                char            m_ConnectionStatus;
                datetime        m_LastTime;
                ulong           m_MemTickTime;
                int             m_CountStrings;
                struct st0
                {
                        string  szTime;
                        int     flag;
                }m_InfoTrades[def_MaxInfos];
                struct st1
                {
                        C_Canvas Canvas;
                        int      WidthRegion,
                                 PosXRegion,
                                 MaxY;
                        string   szNameCanvas;
                }m_InfoCanvas;
Highlighting shows the parts that have been added to the source code. As you can see, we need to use the C_Canvas class, but it does not have all the elements we need. In fact, we have to add four subroutines to this C_Canvas class. These subroutines are shown in the code below:
// ... C_Canvas class code

inline void FontSet(const string name, const int size, const uint flags = 0, const uint angle = 0)
{
        if(!TextSetFont(name, size, flags, angle)) return;
        TextGetSize("M", m_TextInfos.width, m_TextInfos.height);
}
//+------------------------------------------------------------------+
inline void TextOutFast(int x, int y, string text, const uint clr, uint alignment = 0)
{
        TextOut(text, x, y, alignment, m_Pixel, m_width, m_height, clr, COLOR_FORMAT_ARGB_NORMALIZE);
}
//+------------------------------------------------------------------+
inline int TextWidth(void) const { return m_TextInfos.width; }
//+------------------------------------------------------------------+
inline int TextHeight(void) const { return m_TextInfos.height; }
//+------------------------------------------------------------------+

// ... The rest of the code ...
These lines create text. Very simple, nothing extremely elegant.
The next function in this class which is worth mentioning is C_TimesAndTrade:
void PrintTimeTrade(void)
{
        int ui1;

        m_InfoCanvas.Canvas.Erase(clrBlack, 220);
        for (int c0 = 0, c1 = m_CountStrings - 1, y = 2; (c0 <= 255) && (y < m_InfoCanvas.MaxY); c0++, c1--, y += m_InfoCanvas.Canvas.TextHeight())
        if (m_InfoTrades[macro_Limits(c1)].szTime == NULL) break; else
        {
                ui1 = m_InfoTrades[macro_Limits(c1)].flag;
                m_InfoCanvas.Canvas.TextOutFast(2, y, m_InfoTrades[macro_Limits(c1)].szTime, macroColorRGBA((ui1 == 0 ? clrLightSkyBlue : (ui1 > 0 ? clrForestGreen : clrFireBrick)), 220));
        }
        m_InfoCanvas.Canvas.Update();
}
This function will display values in the special area reserved for this. In addition, the initialization procedure has also undergone minor changes, which can be seen below in the highlighted part:
void Init(const int iScale = 2)
{
        if (!ExistSubWin())
        {
                m_InfoCanvas.Canvas.FontSet("Lucida Console", 13);
                m_InfoCanvas.WidthRegion = (18 * m_InfoCanvas.Canvas.TextWidth()) + 4;
                CreateCustomSymbol();
                CreateChart();
                m_InfoCanvas.Canvas.Create(m_InfoCanvas.szNameCanvas, m_InfoCanvas.PosXRegion, 0, m_InfoCanvas.WidthRegion, TerminalInfoInteger(TERMINAL_SCREEN_HEIGHT), GetIdSubWinEA());
                Resize();
                m_ConnectionStatus = 0;
        }
        ObjectSetInteger(Terminal.Get_ID(), m_szObjName, OBJPROP_CHART_SCALE, (iScale > 5 ? 5 : (iScale < 0 ? 0 : iScale)));
}
Additional changes were also required in the substitution routine in the Times & Trade. The changes are as follows:
void Resize(void)
{
        static int MaxX = 0;
        int x = (int) ChartGetInteger(Terminal.Get_ID(), CHART_WIDTH_IN_PIXELS, GetIdSubWinEA());

        m_InfoCanvas.MaxY = (int) ChartGetInteger(Terminal.Get_ID(), CHART_HEIGHT_IN_PIXELS, GetIdSubWinEA());
        ObjectSetInteger(Terminal.Get_ID(), m_szObjName, OBJPROP_YSIZE, m_InfoCanvas.MaxY);
        if (MaxX != x)
        {
                MaxX = x;
                x -= m_InfoCanvas.WidthRegion;
                ObjectSetInteger(Terminal.Get_ID(), m_szObjName, OBJPROP_XSIZE, x);
                ObjectSetInteger(Terminal.Get_ID(), m_InfoCanvas.szNameCanvas, OBJPROP_XDISTANCE, x);
        }
        PrintTimeTrade();
}
The system is almost ready, but we still need the subroutine that is in the heart if the system. It has also been modified:
inline void Update(void)
{
        MqlTick Tick[];
        MqlRates Rates[def_SizeBuff];
        int i0, p1, p2 = 0;
        int iflag;
        long lg1;
        static int nSwap = 0;
        static long lTime = 0;

        if (m_ConnectionStatus < 3) return;
        if ((i0 = CopyTicks(Terminal.GetFullSymbol(), Tick, COPY_TICKS_ALL, m_MemTickTime, def_SizeBuff)) > 0)
        {
                for (p1 = 0, p2 = 0; (p1 < i0) && (Tick[p1].time_msc == m_MemTickTime); p1++);
                for (int c0 = p1, c1 = 0; c0 < i0; c0++)
                {
                        lg1 = Tick[c0].time_msc - lTime;
                        nSwap++;
                        if (Tick[c0].volume == 0) continue;
                        iflag = 0;
                        iflag += ((Tick[c0].flags & TICK_FLAG_BUY) == TICK_FLAG_BUY ? 1 : 0);
                        iflag -= ((Tick[c0].flags & TICK_FLAG_SELL) == TICK_FLAG_SELL ? 1 : 0);
                        if (iflag == 0) continue;
                        Rates[c1].high = Tick[c0].ask;
                        Rates[c1].low = Tick[c0].bid;
                        Rates[c1].open = Tick[c0].last;
                        Rates[c1].close = Tick[c0].last + ((Tick[c0].volume > 200 ? 200 : Tick[c0].volume) * (Terminal.GetTypeSymbol() == C_Terminal::WDO ? 0.02 : 1.0) * iflag);
                        Rates[c1].time = m_LastTime;
                        m_InfoTrades[macro_Limits(m_CountStrings)].szTime = StringFormat("%02.d.%03d ~ %02.d <>%04.d", ((lg1 - (lg1 % 1000)) / 1000) % 60 , lg1 % 1000, nSwap, Tick[c0].volume);
                        m_InfoTrades[macro_Limits(m_CountStrings)].flag = iflag;
                        m_CountStrings++;
                        nSwap = 0;
			lTime = Tick[c0].time_msc;
                        p2++;
                        c1++;
                        m_LastTime += 60;
                }
                CustomRatesUpdate(m_szCustomSymbol, Rates, p2);
                m_MemTickTime = Tick[i0 - 1].time_msc;
        }
        PrintTimeTrade();
}
The highlighted lines represent the code added to the subroutine to model the data we need. The following code
lg1 = Tick[c0].time_msc - lTime;
nSwap++;
checks how much time has passed between trades in milliseconds, and how many trades that did not cause a price change occurred. If these numbers are large, you can understand that the turnover is decreasing. With this feature you will notice this earlier than others.
The following part
m_InfoTrades[macro_Limits(m_CountStrings)].szTime = StringFormat("%02.d.%03d ~ %02.d <>%04.d", ((lg1 - (lg1 % 1000)) / 1000) % 60 , lg1 % 1000, nSwap, Tick[c0].volume);
m_InfoTrades[macro_Limits(m_CountStrings)].flag = iflag;
m_CountStrings++;
nSwap = 0;
lTime = Tick[c0].time_msc;
will model the values that will be presented. Please note that we will not test the m_CountStrings counter due to its limited use. We will simply increase its values as new information becomes available. This is a trick that can sometimes be used. I myself use it when possible, as it is efficient in terms of processing, which is important as the trading system is designed to be used in real time. You should always try to optimize the system whenever possible, even if only a little — in the end it makes a big difference.
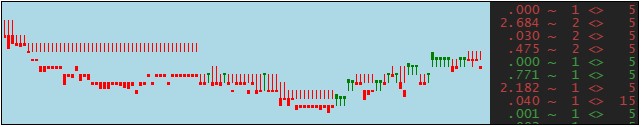
After everything has been implemented, compile the Expert Advisor and get something like this:
Watching the movements that described above on the Times & Trade chart, you can see that microstructures start appearing in the Times & Trade itself. However, even after studying these microstructures, I could not take any advantage of the fact that they exist. However, I'm not that experienced a trader, so who knows, maybe someone with more experience can do it.
This indicator is so powerful and so informative that I decided to make a video showing a small comparison between its values and real data shown by the asset at the time of writing. I want to demonstrate that it filters a lot of information, allowing you to read data much faster and understand better what is happening. I hope you enjoy and take advantage of this fantastic and powerful indicator.