Multiple indicators on one chart (Part 03): Developing definitions for users
Daniel Jose | 3 May, 2022
Introduction
In the previous article within the Multiple indicators on one chart we considered the basic code which allows using more than one indicator in a chart subwindow. But what was presented was just the starting base of a much larger system. A few different things can be done based on this model. But we should go step by step because one of the goals of these articles is to encourage you to learn how to program so that you can design your own systems based on your ideas. In this article, we will be expanding the functionality. It may be interesting to those who already liked what the system can do but would like to be able to do more.
Planning
Often when we start implementing a new system we don't have a real idea of how much we can improve it, so we should always start a new project with an eye on how it might be subject to future improvements. This is very important for those who are in the very beginning: to be constantly planning something and imagining future expansions and improvements.
The core code hasn't changed at all, which in a sense was already expected. But the object class code has changed drastically. We made these changes to implement new features and to be able to create new improvements in an even more flexible way, as code reuse becomes even more significant (and this is one of the basic ideas of object-oriented programming: always reuse, create new only when necessary). So, let's take a look at the new object class. I will highlight the changes to make them easier to understand.
Let's start with new definitions of private class variables.
struct st
{
        string  szObjName,
                szSymbol;
        int     width;
}m_Info[def_MaxTemplates];
int             m_IdSubWin,
                m_Counter,
                m_CPre,
                m_Aggregate;
long            m_Id,
                m_handle;
ENUM_TIMEFRAMES m_Period;
Pay attention that the number of variables used has increased significantly. This is because we need more data to properly manage the new functionality. Now our variable system has a structure. Such structures are very good for grouping related variables together — they ensure that when we manipulate data we have quick and easy access to it.
void SetBase(const string szSymbol, int iScale, int iSize)
{
#define macro_SetInteger(A, B) ObjectSetInteger(m_Id, m_Info[m_Counter].szObjName, A, B)
        if (m_IdSubWin < 0)
        {
                m_Id = ChartID();
                m_IdSubWin = (int)ChartGetInteger(m_Id, CHART_WINDOWS_TOTAL) - 1;
                m_Aggregate = 0;
        }
        m_Info[m_Counter].szObjName = __FILE__ + (string) MathRand() + (string) ObjectsTotal(m_Id, -1, OBJ_CHART);
        ObjectCreate(m_Id, m_Info[m_Counter].szObjName, OBJ_CHART, m_IdSubWin, 0, 0);
        ObjectSetString(m_Id, m_Info[m_Counter].szObjName, OBJPROP_SYMBOL, (m_Info[m_Counter].szSymbol = szSymbol));

// ....

        macro_SetInteger(OBJPROP_PERIOD, m_Period);
        m_handle = ObjectGetInteger(m_Id, m_Info[m_Counter].szObjName, OBJPROP_CHART_ID);
        m_Aggregate += iSize;
        m_Info[m_Counter].width = iSize;
        m_CPre += (iSize > 0 ? 1 : 0);
        m_Counter++;
#undef macro_SetInteger
};
The main change we will see shortly is that we are using a structure to store the asset name, the object name and its width. So now we also can specify the width that the indicator will have in the subwindow. Let's also make some notes to use them in other parts of the class. Below is the function that has changed the most.
void Decode(string &szArg, int &iScale, int &iSize)
{
#define def_ScaleDefault 4
#define macro_GetData(A)                \
        b0 = false;                     \
        for (c0++; (c0 < max) && (szArg[c0] == ' '); c0++);     \
        for (i0 = 0, i1 = c0; (c0 < max) && (szArg[c0] != A); i0 = (szArg[c0] != ' ' ? c0 - i1 + 1 : i0), c0++);        \
        if (szArg[c0] == A) sz1 = StringSubstr(szArg, i1, i0); else sz1 = "";

        string sz1;
        int i0, i1, c1 = StringLen(szArg);
        bool b0 = true;
        StringToUpper(szArg);
        iScale = def_ScaleDefault;
        m_Period = _Period;
        for (int c0 = 0, max = StringLen(szArg); c0 < max; c0++) switch (szArg[c0])
        {
                case ':':
                        b0 = false;
                        for (; (c0 < max) && ((szArg[c0] < '0') || (szArg[c0] > '9')); c0++);
                        iScale = (int)(szArg[c0] - '0');
                        iScale = ((iScale > 5) || (iScale < 0) ? def_ScaleDefault : iScale);
                        break;
                case ' ':
                        break;
                case '<':
                        macro_GetData('>');
                        if (sz1 == "1M") m_Period = PERIOD_M1; else

//....

                        if (sz1 == "1MES") m_Period = PERIOD_MN1;
                        break;
                case '[':
                        macro_GetData(']');
                        iSize = (int) StringToInteger(sz1);
                        break;
                default:
                        c1 = (b0 ? c0 : c1);
                        break;
        }
        szArg = StringSubstr(szArg, 0, c1 + 1);
#undef macro_GetData
#undef def_ScaleDefault
}
Green shows additions to the code. Yellow is used for the lines that already existed in the source code but were moved for practical reasons. Now let's look at what all these additions do in the code and, more importantly, what they improve in terms of the functionality of the original system. Actually, we are creating a basis to enable the user to customize some specific things. We are trying to do this by adding new rules to the existing syntax (see the table below):
| Separator | Functionality | Example | Result |
|---|---|---|---|
| < > | Specifies the graphic period to be used | < 15m > | Fixes the indicator period at 15 minutes. The original chart can use a different period, but the indicator will only be displayed with 15-minutes data. |
| [ ] | Specifies the indicator width | [ 350 ] | Fixes the indicator width at 350 pixels. |
The separator that fixes the chart period — only in the indicator window, does not affect any changes that the user can make. All other indicators and the main chart will be updated to the new chart period selected by the user, but the fixed indicator will not follow the new chart period. In some cases, this can be interesting, as shown in the image below.
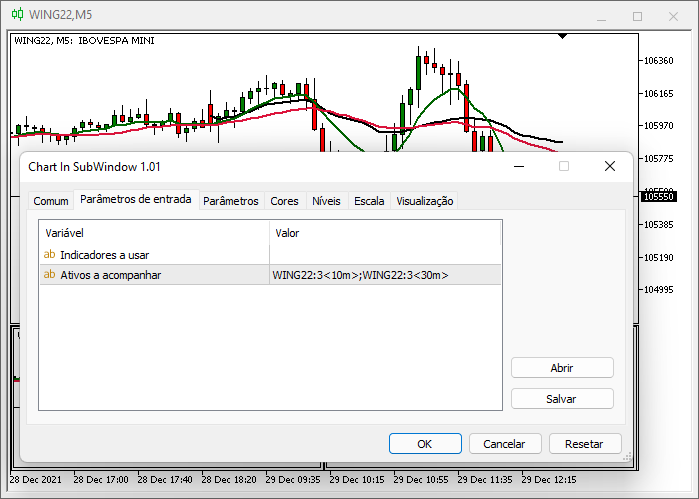

This greatly facilitates various types of settings where we need to keep charts of the same asset with different periods visible on the trading screen. Now a separator that fixes the chart width will make this easier in even more specific cases. It has another very big use that we will explore in another article, but for now you can use it in order to control the indicator width.
You can use a combination of all separators or just the one you really need in the indicator, as there are no specific rules. The only rule is that the indicator name should be placed before everything else. Let's get back to the code explanation. Look at the following lines:
#define macro_GetData(A)                \
        b0 = false;                     \
        for (c0++; (c0 < max) && (szArg[c0] == ' '); c0++);     \
        for (i0 = 0, i1 = c0; (c0 < max) && (szArg[c0] != A); i0 = (szArg[c0] != ' ' ? c0 - i1 + 1 : i0), c0++);        \
        if (szArg[c0] == A) sz1 = StringSubstr(szArg, i1, i0); else sz1 = "";

//....
                case '<':
                        macro_GetData('>');
Note that we are defining something that may seem strange to many. But its name can be helpful here: macro_GetData(A), this creates a piece of code which is a macro. When the compiler finds this definition in the code, the compiler will replace the declaration with the macro code. This will be very useful if we are going to repeat a certain code part in several places, but with minimal changes between one declaration and another. In the previous example, the line in green will be replaced and the code generated by the compiler will be as follows:
case '<':
	b0 = false;
        for (c0++; (c0 < max) && (szArg[c0] == ' '); c0++);
        for (i0 = 0, i1 = c0; (c0 < max) && (szArg[c0] != '>'); i0 = (szArg[c0] != ' ' ? c0 - i1 + 1 : i0), c0++);
        if (szArg[c0] == A) sz1 = StringSubstr(szArg, i1, i0); else sz1 = "";
//....
This kind of thing is the truest expression of the philosophy: reuse as much as possible, write as little new as possible. Now let's look at what can be changed if we want to make the syntax clearer. It's a small detail, but it can be much nicer if tailored to your personal style. Take a look at the following line:
//.....

if (sz1 == "1M") m_Period = PERIOD_M1; else

//.....
The highlighted information is an important detail. According to the model I used, if the user wants to use a period of 1 minute, the user should indicate this using the following syntax: MIN_1. If you want to have an individual style, you can specify it your own way. But the letters should be in uppercase and without spaces. For example, the selected part can be replaced with "1MIN", "MIN_1", "1_MINUTE" or something with even more details, for example: "LOCK_IN_1_MIN" or in your language - this will work as long as there are no spaces between words. Actually, this space restriction can be removed, but it seems to me that there is no real need to do so. See how nice it is to know programming — you can use things with your own individual style. The next code that I have modified is the default destructor.
~C_TemplateChart()
{
        for (char c0 = 0; c0 < m_Counter; c0++)
        {
                ObjectDelete(m_Id, m_Info[c0].szObjName);
                SymbolSelect(m_Info[c0].szSymbol, false);
        }
}
The highlighted line has been added for the following cases: if an asset is not open in a separate window, it should no longer appear in Market Watch. This prevents unused assets from being there, taking up space and polluting the window. Now let's look at what I promised to explain in the previous article. This did not exist in the original code, but it will be part of code in the future.
void AddTemplate(const eTypeChart type, const string szTemplate, int scale, int iSize)
{
        if (m_Counter >= def_MaxTemplates) return;
        if (type == SYMBOL) SymbolSelect(szTemplate, true);
        SetBase((type == INDICATOR ? _Symbol : szTemplate), scale, iSize);
        if (!ChartApplyTemplate(m_handle, szTemplate + ".tpl")) if (type == SYMBOL) ChartApplyTemplate(m_handle, "Default.tpl");
        ChartRedraw(m_handle);
}
The highlighted line makes it possible to use a default settings file if all observed assets use the same settings. It's no good doing something without really understanding how you should actually act if things don't go as expected. But if the settings are EXACTLY the same why not use them? Please note that if a settings file for the specified asset is not found, it is understood that you want to use default MetaTrader 5 settings which are defined in the DEFAULT.TPL file, which is locate in the Profiles\Template directory. But first we need to understand one important thing. Why haven't I indicated a single directory in the ChartApplyTemplate function? This is because MetaTrader 5 performs search following a certain logic. Knowing how this logic works can help in understanding situations in more interesting and less stressed ways.
Imagine the following scenario where we replace the highlighted line with this one:
if (!ChartApplyTemplate(m_handle, "MyTemplates\\" + szTemplate + ".tpl")) if (type == SYMBOL) ChartApplyTemplate(m_handle, ""MyTemplates\\Default.tpl");
MetaTrader 5 will first search for the settings file in the MYTEMPLATES subdirectory of the directory in which the custom indicator executable file is located, i.e. if there is the MYTEMPLATES folder in the same folder where the executable file used for creating multiple indicators is located, MetaTrader 5 will search for the file exactly there. However, if nothing is found there, it will search for the same file in the MQL5\Profiles\Templates\MyTemplates directory, that's why I didn't show this before. But it's not just that. There's another detail in the same code:
if (!ChartApplyTemplate(m_handle, "\\MyTemplates\\" + szTemplate + ".tpl")) if (type == SYMBOL) ChartApplyTemplate(m_handle, ""\\MyTemplates\\Default.tpl");
One small detail that changes everything: now MetaTrader 5 will first try to find the file in the MQL5 MyTemplates directory, and if it does not find the file, it will follow the steps described above. You can find this information in ChartApplyTemplate documentation, because I don't want to confuse those who don't know how MetaTrader 5 works. But now that you understand how the search is performed, you can create variations and you know where to put the file.
The next function in our class which has undergone significant changes is shown below:
void Resize(void)
{
#define macro_SetInteger(A, B) ObjectSetInteger(m_Id, m_Info[c0].szObjName, A, B)
        int x0 = 0, x1, y = (int)(ChartGetInteger(m_Id, CHART_HEIGHT_IN_PIXELS, m_IdSubWin));
        x1 = (int)((ChartGetInteger(m_Id, CHART_WIDTH_IN_PIXELS, m_IdSubWin) - m_Aggregate) / (m_Counter > 0 ? (m_CPre == m_Counter ? m_Counter : (m_Counter - m_CPre)) : 1));
        for (char c0 = 0; c0 < m_Counter; x0 += (m_Info[c0].width > 0 ? m_Info[c0].width : x1), c0++)
        {
                macro_SetInteger(OBJPROP_XDISTANCE, x0);
                macro_SetInteger(OBJPROP_XSIZE, (m_Info[c0].width > 0 ? m_Info[c0].width : x1));
                macro_SetInteger(OBJPROP_YSIZE, y);
        }
        ChartRedraw();
#undef macro_SetInteger
}
The selected lines show the most important calculations in this function. They adjust the windows the way the user wants, but the windows that have been set to a fixed size will create a free area where the rest will have their defined sizes. But if the width of the main window is reduced, the calculation in blue will not allow to reduce width of fixed size windows, which can cause a problem. But let's leave it as is for now, as fixed-width windows have other benefits that will be better explored in the future. And the last change in our class is as follows:
void AddThese(const eTypeChart type, string szArg)
{
        string szLoc;
        int i0, iSize;
//....
        Decode(szLoc, i0, iSize);
        AddTemplate(type, szLoc, i0, iSize);
//....
}
The only change is highlighted, so there is nothing special.
Conclusion
I hope this article, like others, shows how interesting the structured programming is. With a few tweaks and peace of mind, we can add a lot of functionality to the system. Code reuse will make maintenance much easier, because the more we use the finished code, the less likely it is to contain bugs. In the next article, we will take this system to other places where it can be more interesting for many and will try to understand further details about programming. See you...