
The Atomic Analyst is a PA Price Action Indicator that uses Strength and Momentum of the price to find a better edge in the market. Equipped with advanced filters which help remove noises and false signals, and Increase Trading Potential. Using Multiple layers of complex Indicators, the Atomic Analyst scans the chart and turn complex mathematical calculations into simple signals and colors that Any beginner trader can understand and use to take consistent trading decisions.

Features:
- Non-repainting, non-redrawing and non-lagging indicators
- Max Activations
- MTF Trend Scanner
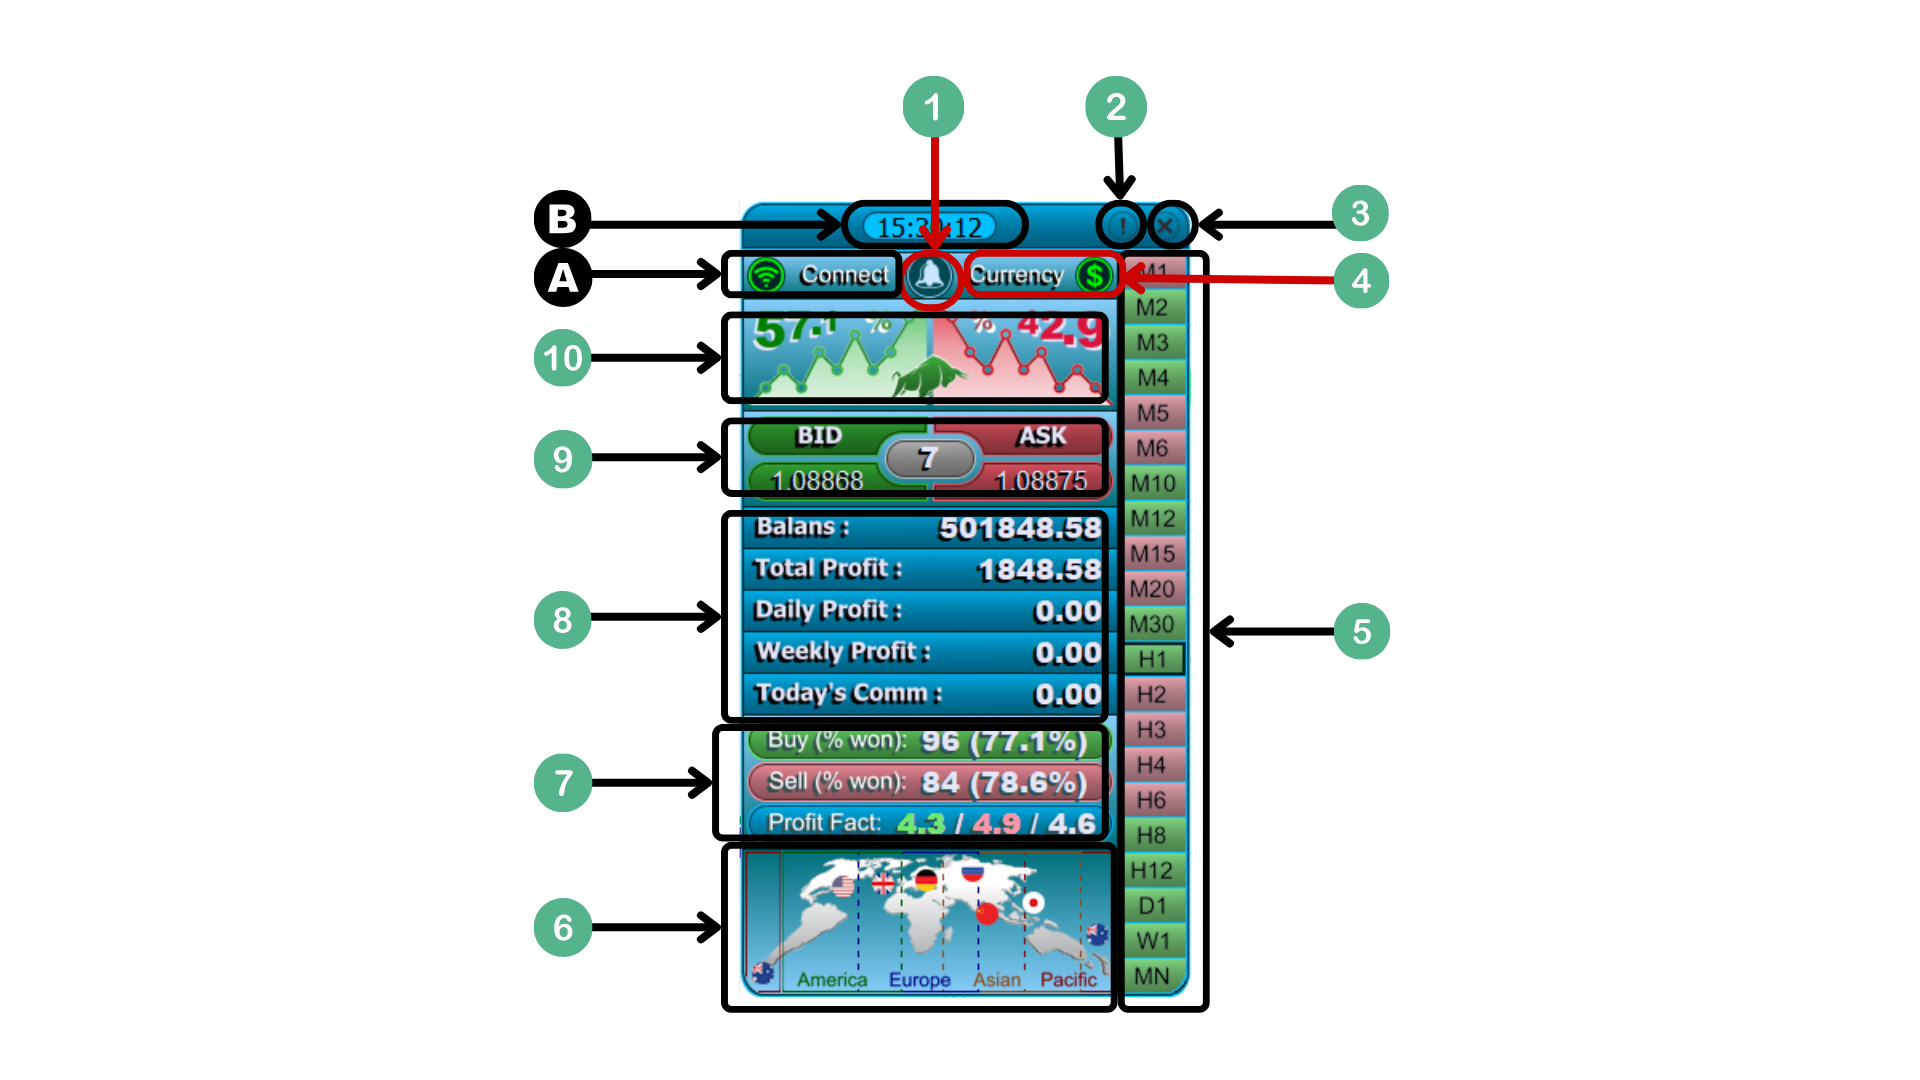
- Modern User Friendly Interface GUI
- Multiple Indicators all in one
- Intra-day, Day and swing trading strategy
- Prop firm ready
- Entry and exit points and arrows
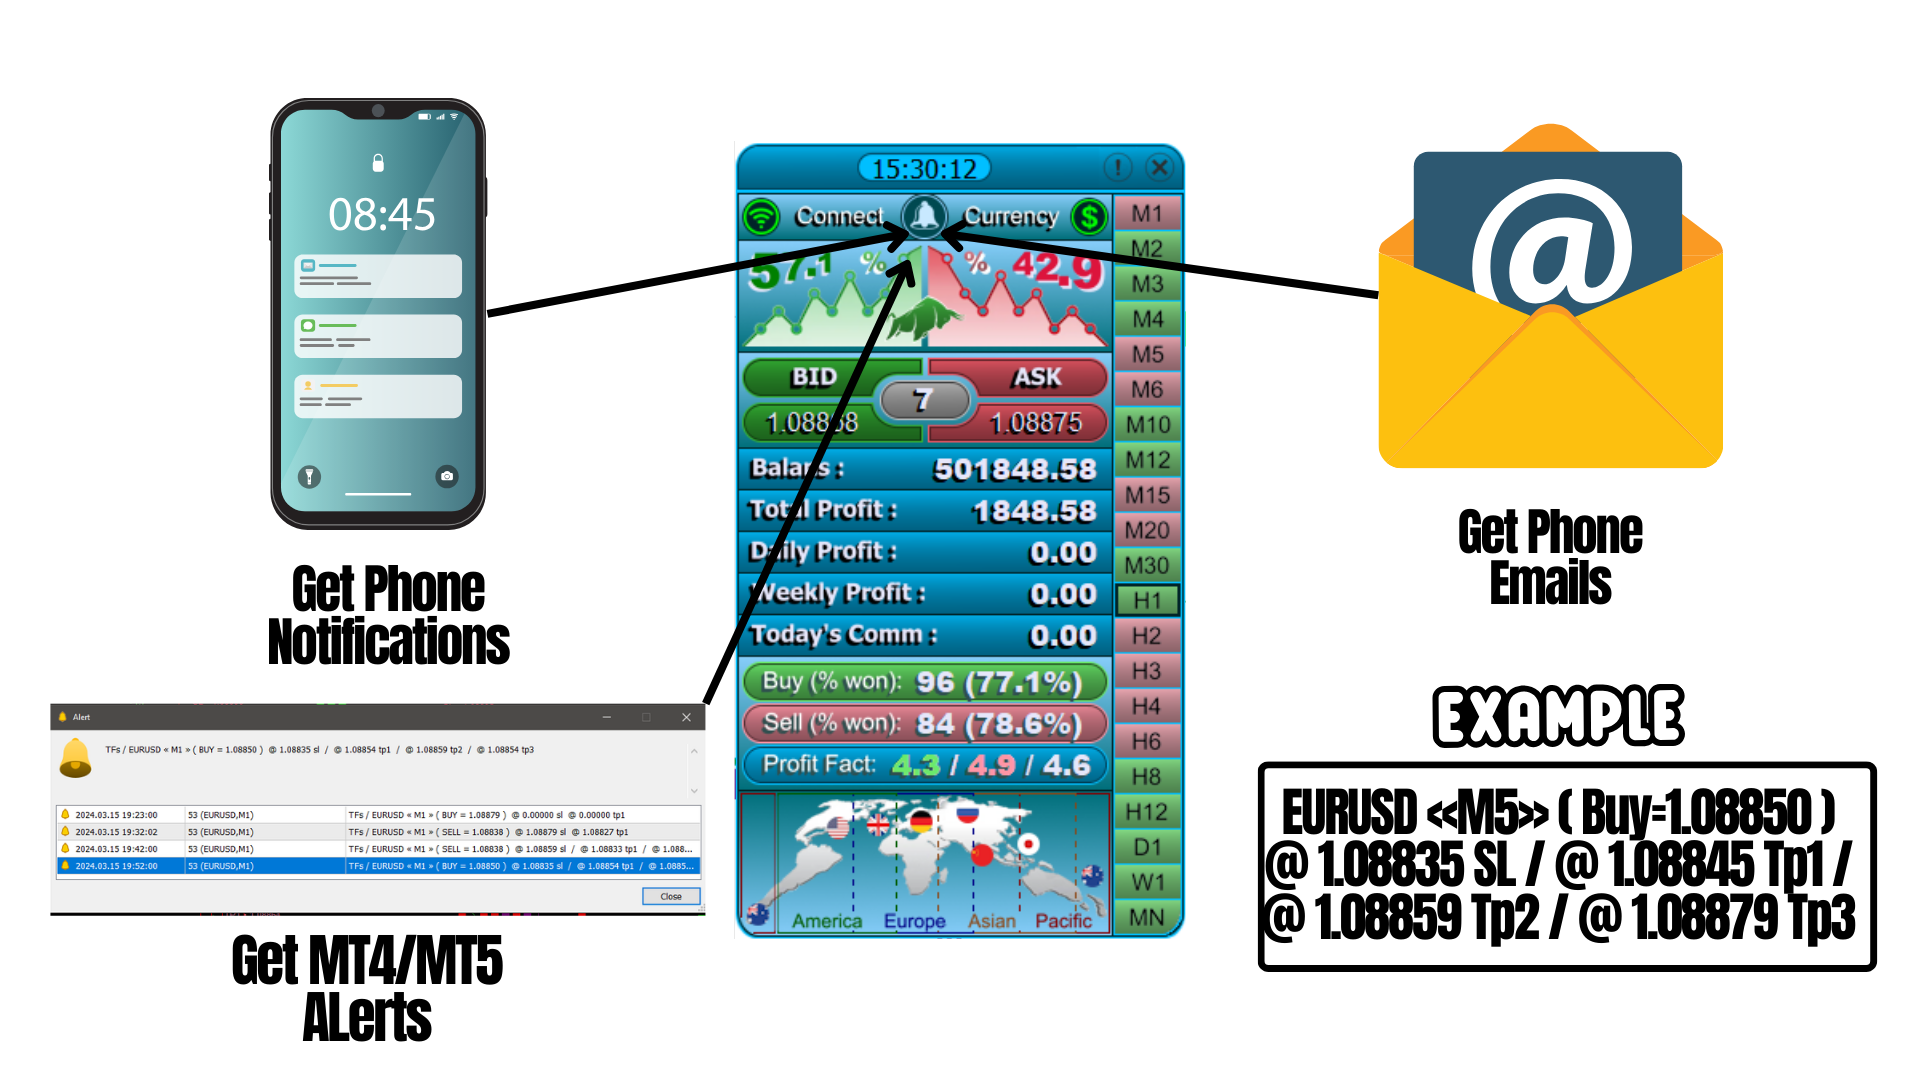
- Alerts to phone and email
- MTF analysis
- Over all timeframes trend % calculation
- Stop Loss
- Multiple Take Profits
- Trailing stop
- Sell trades and Buy trades Potential Win % Display with Total Number of Trades
- Live trading Time Session
- Live Daily, Weekly and All time Profit
- Live Daily Commission Calculation
- Bid and Ask Price Display
- Live Spread Display
- Candle timer, Local time and Server time
- Terminal Status Connected/Disconnected
- Account Currency Display
- Use the Panel to Change the Timeframes

There are many approach to go about this indicator:
- Active trading (by attending the screen all the trading duration):
Lets dive into this approach, This way the trader will be attending and active with the charts, he/she will use extra confirmation by looking at the signals provided before taking them:
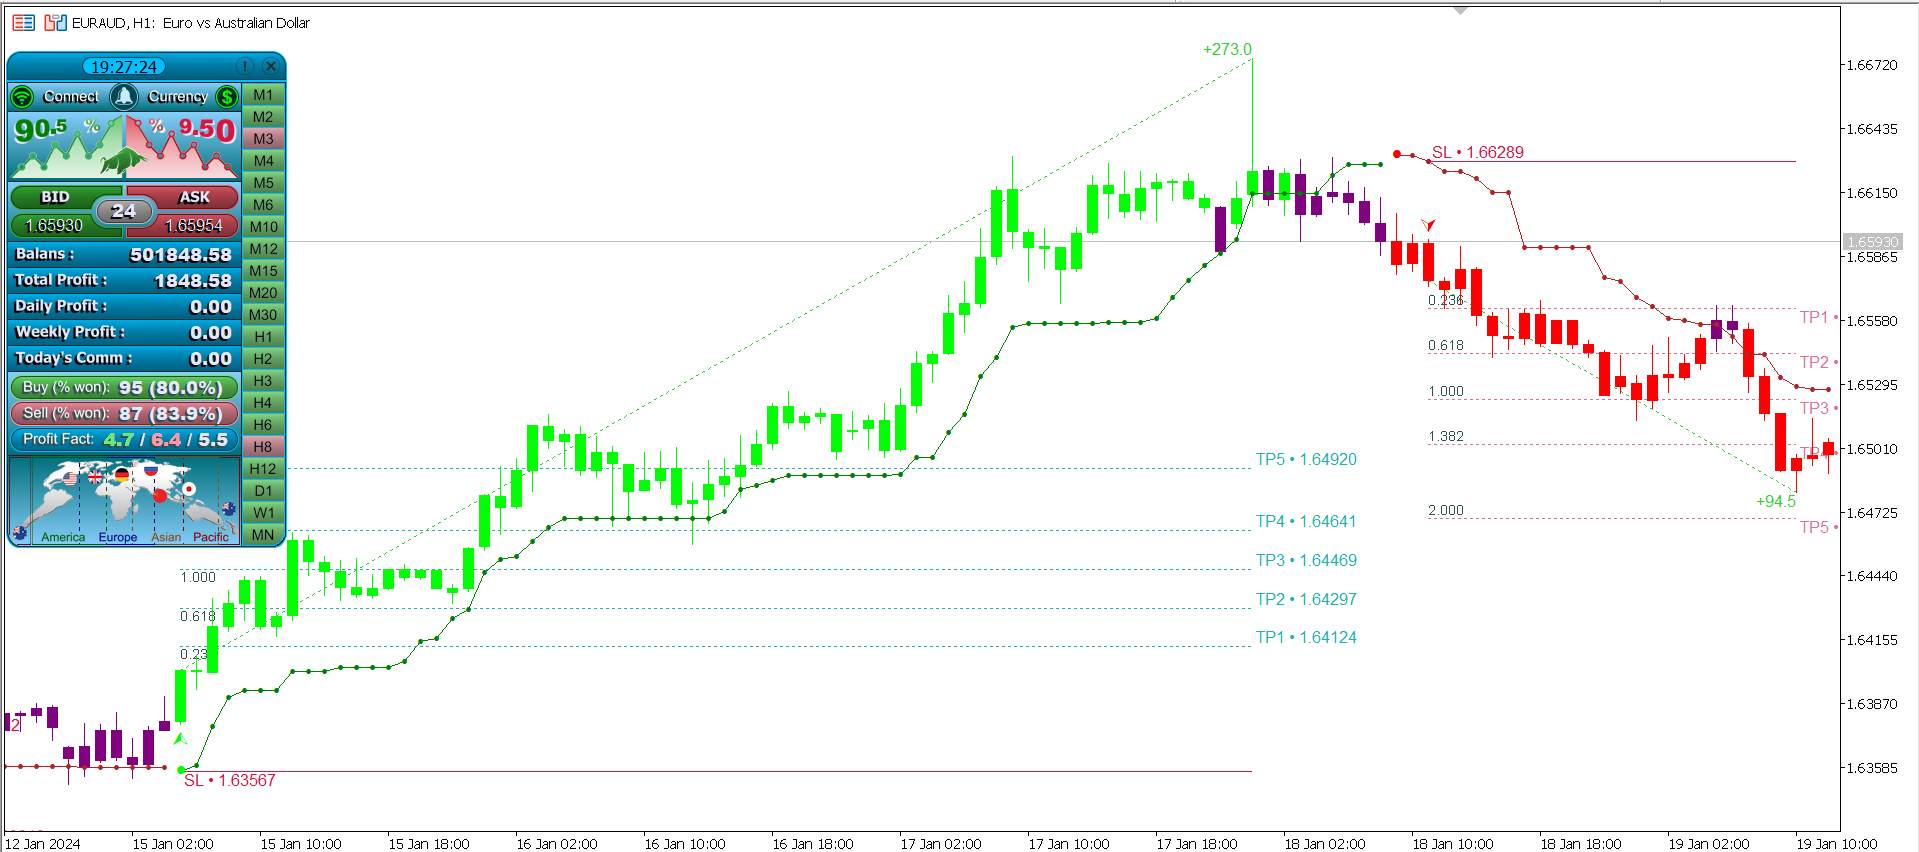
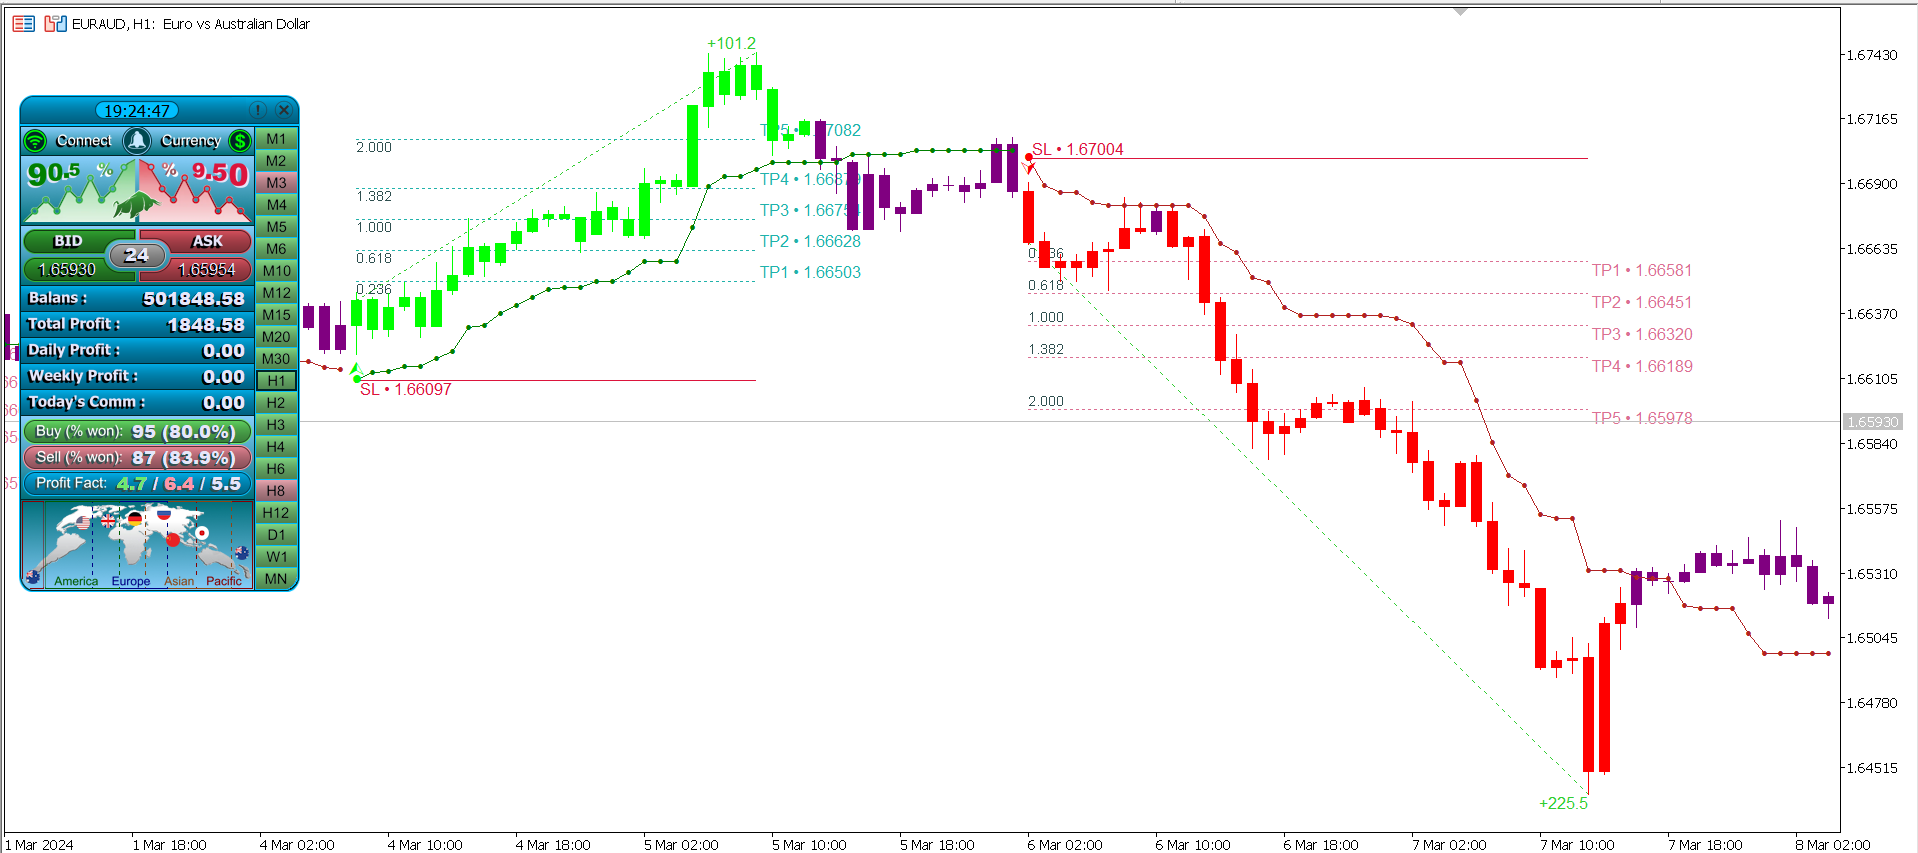
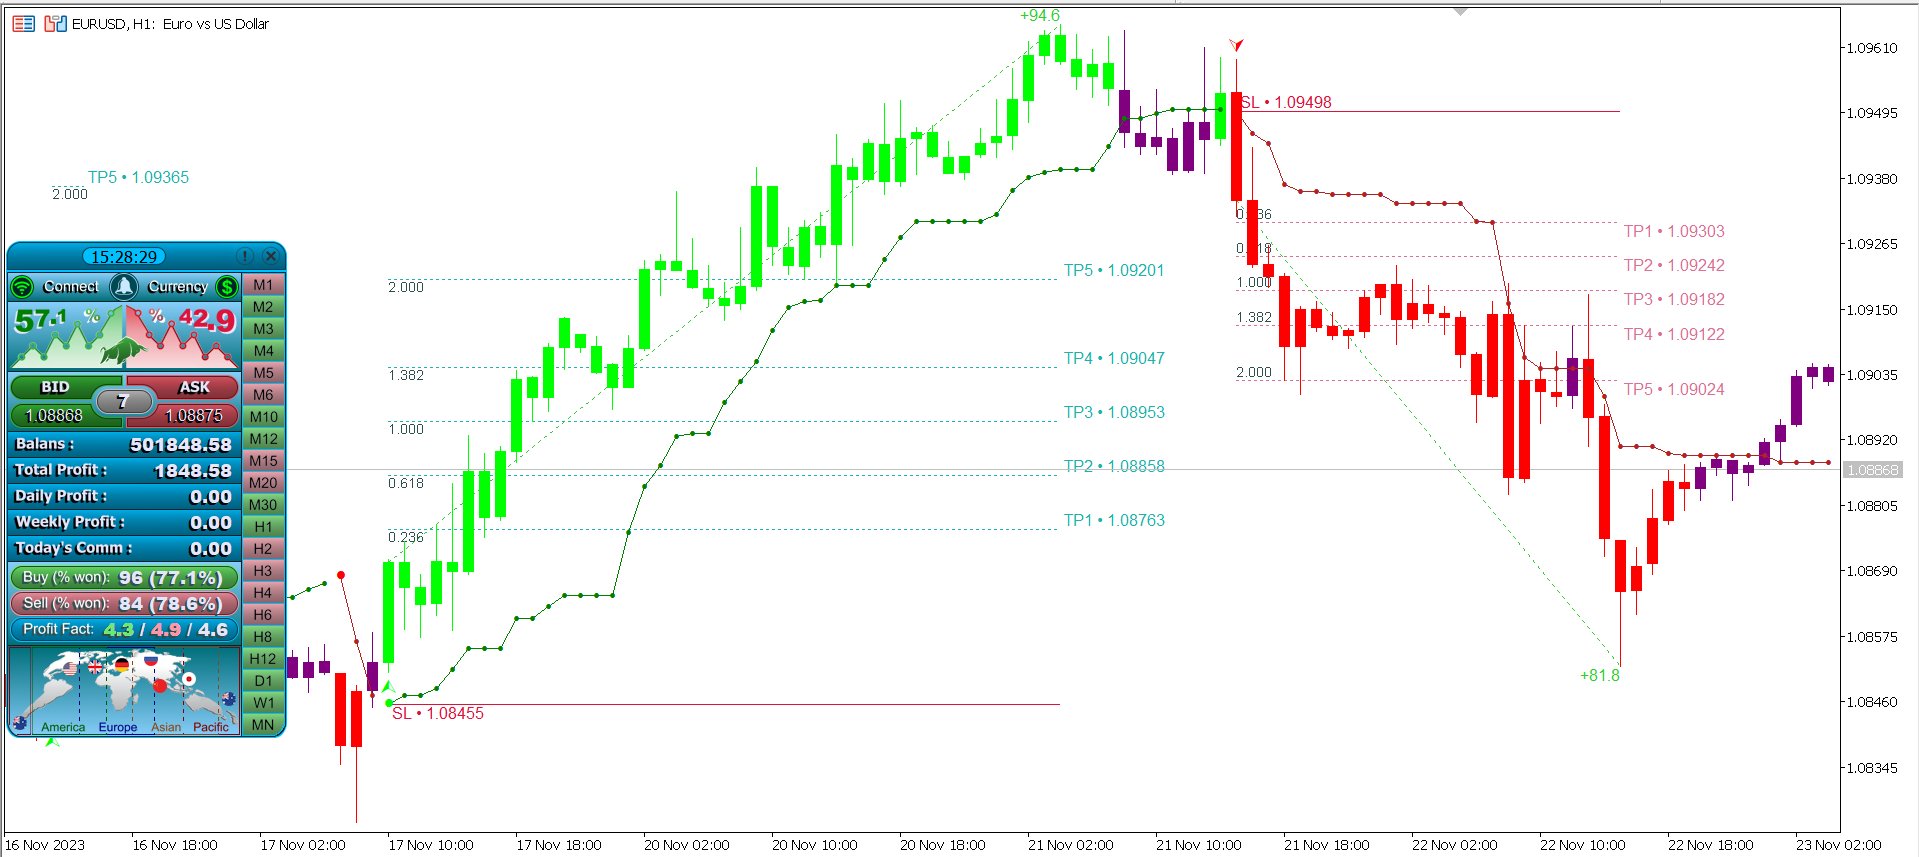
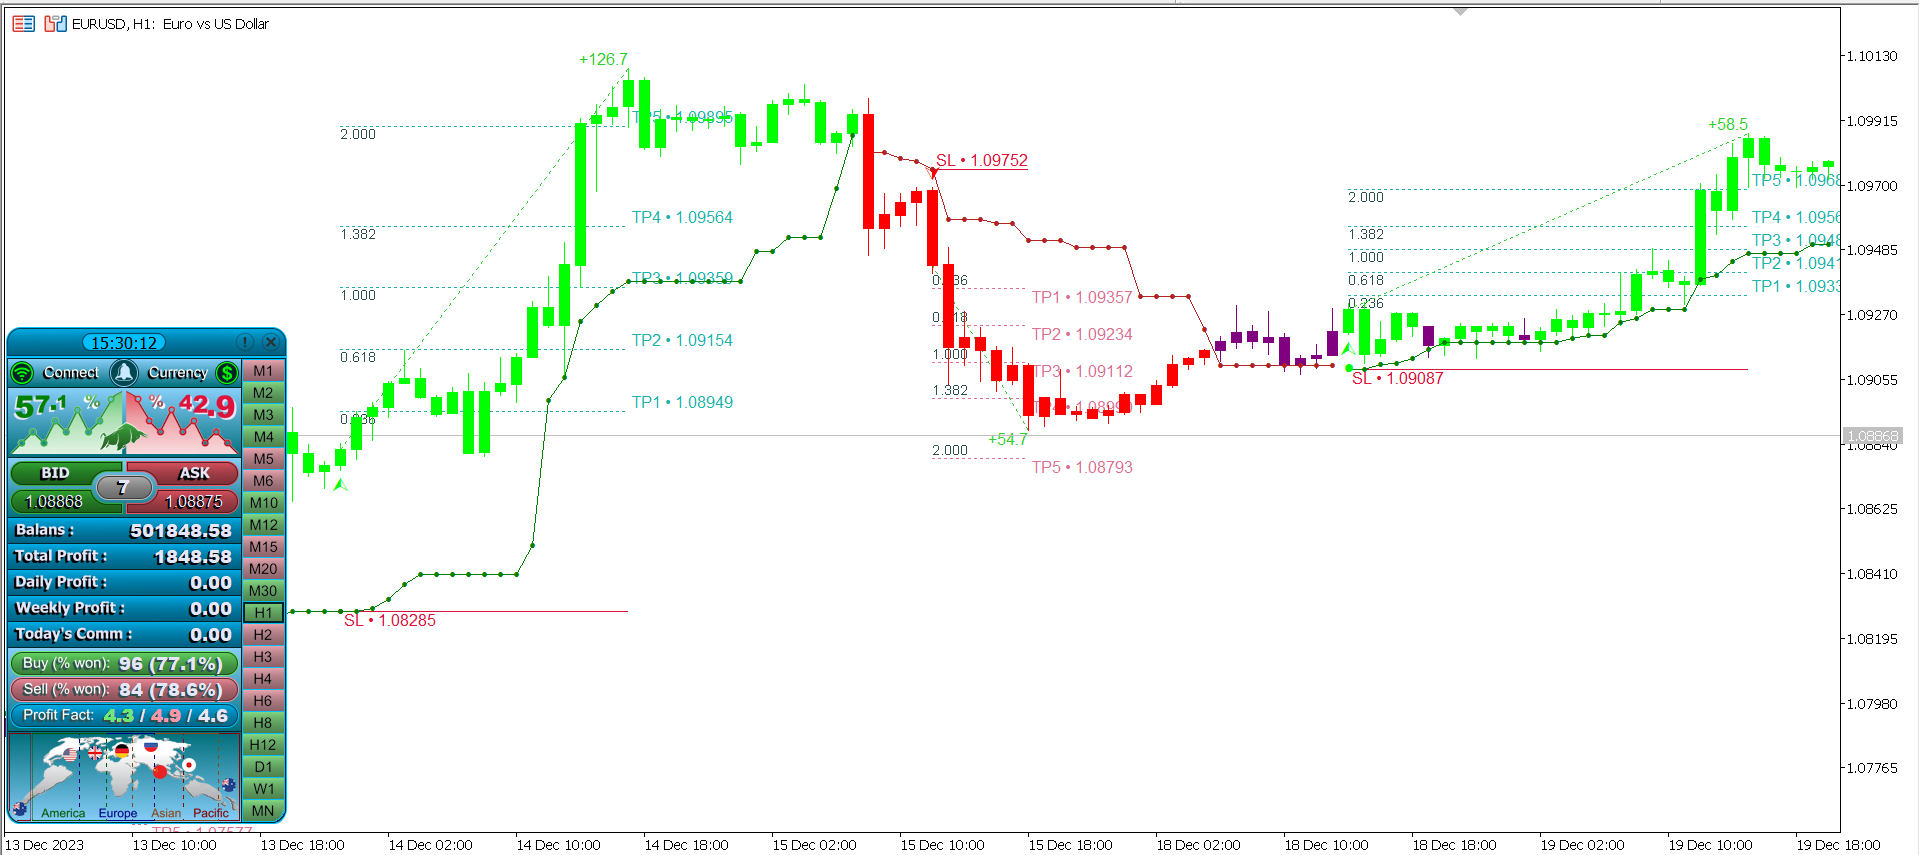
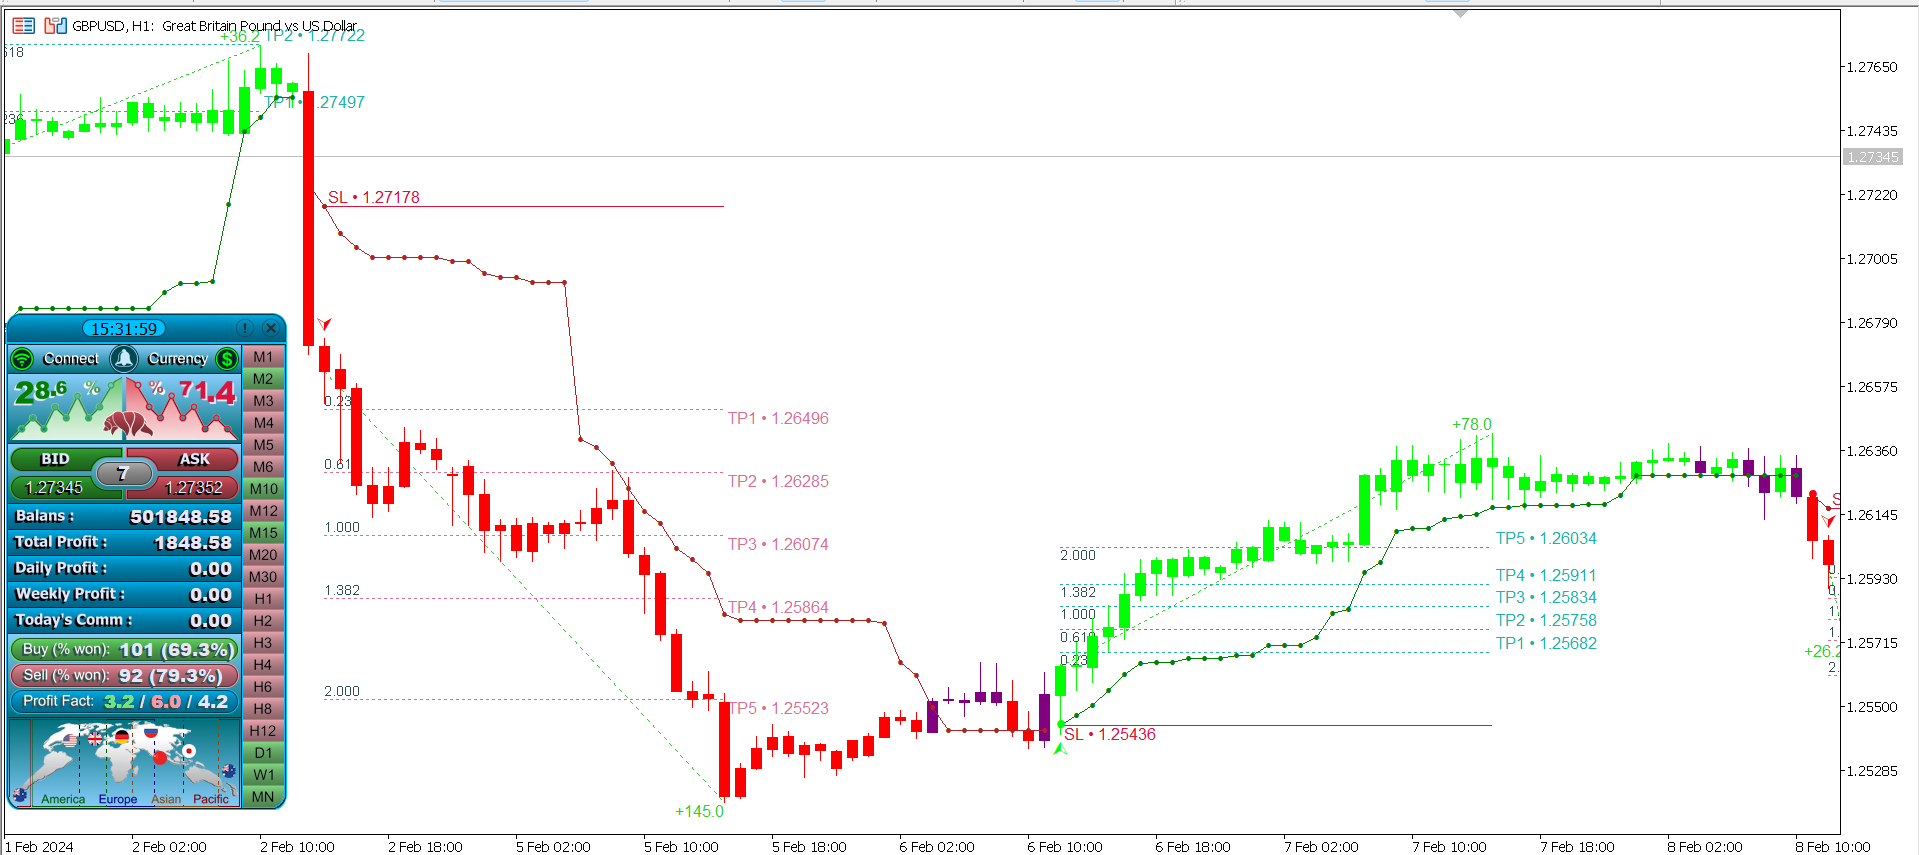
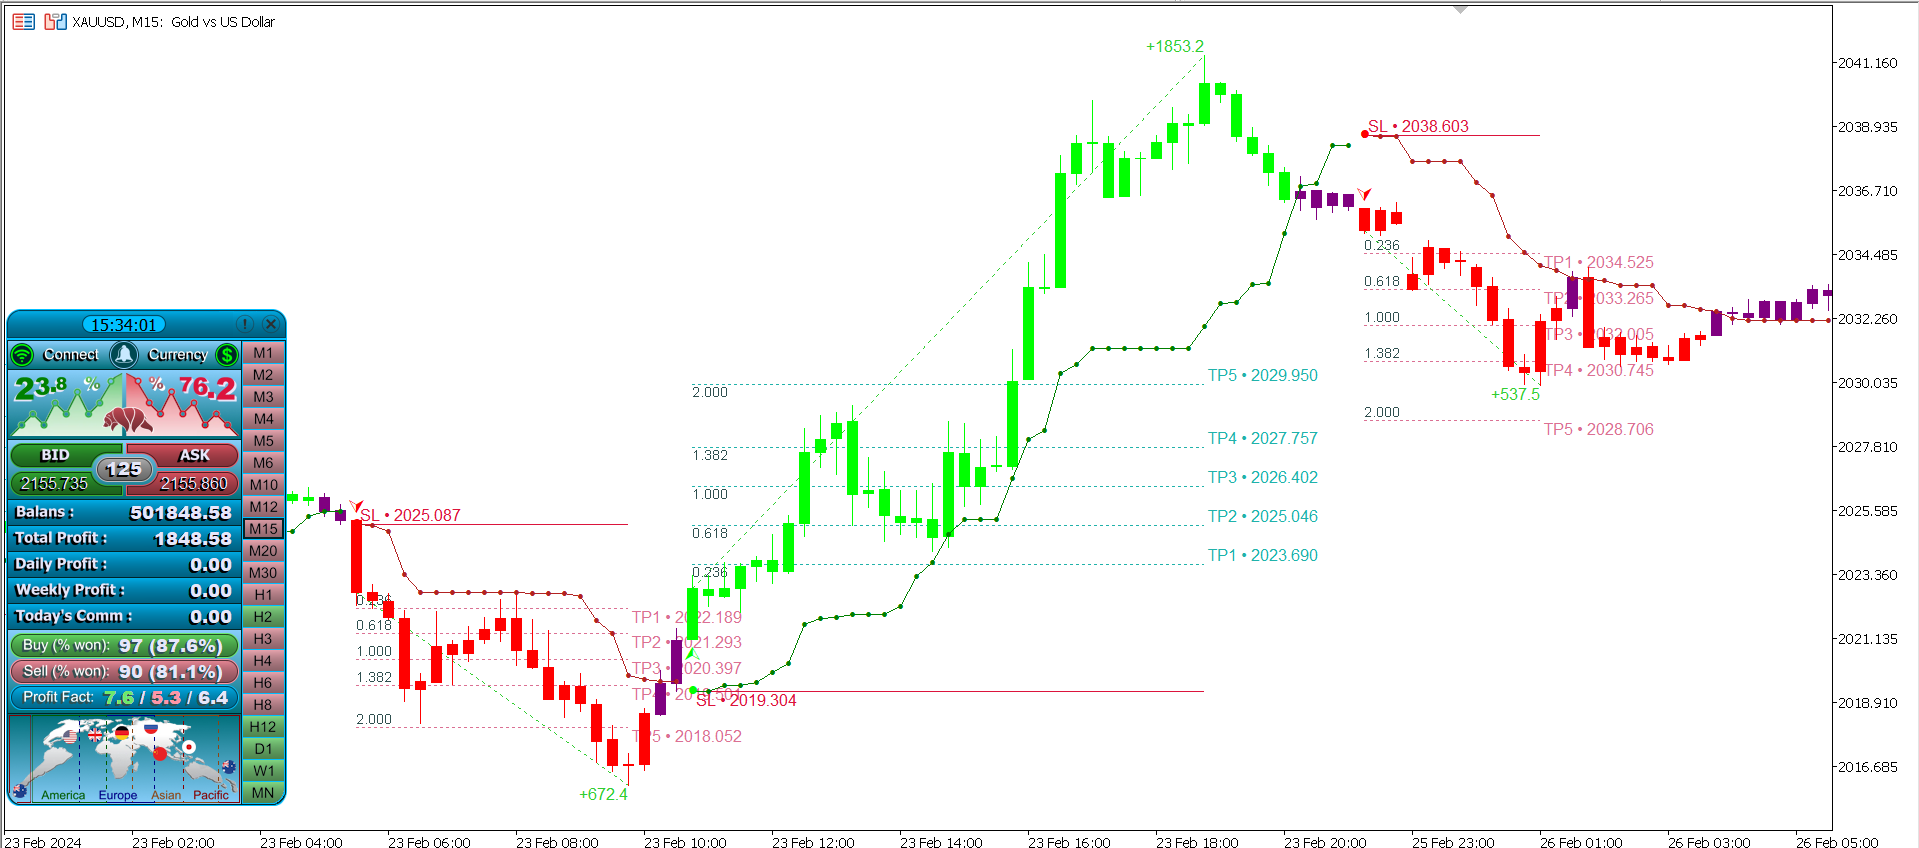
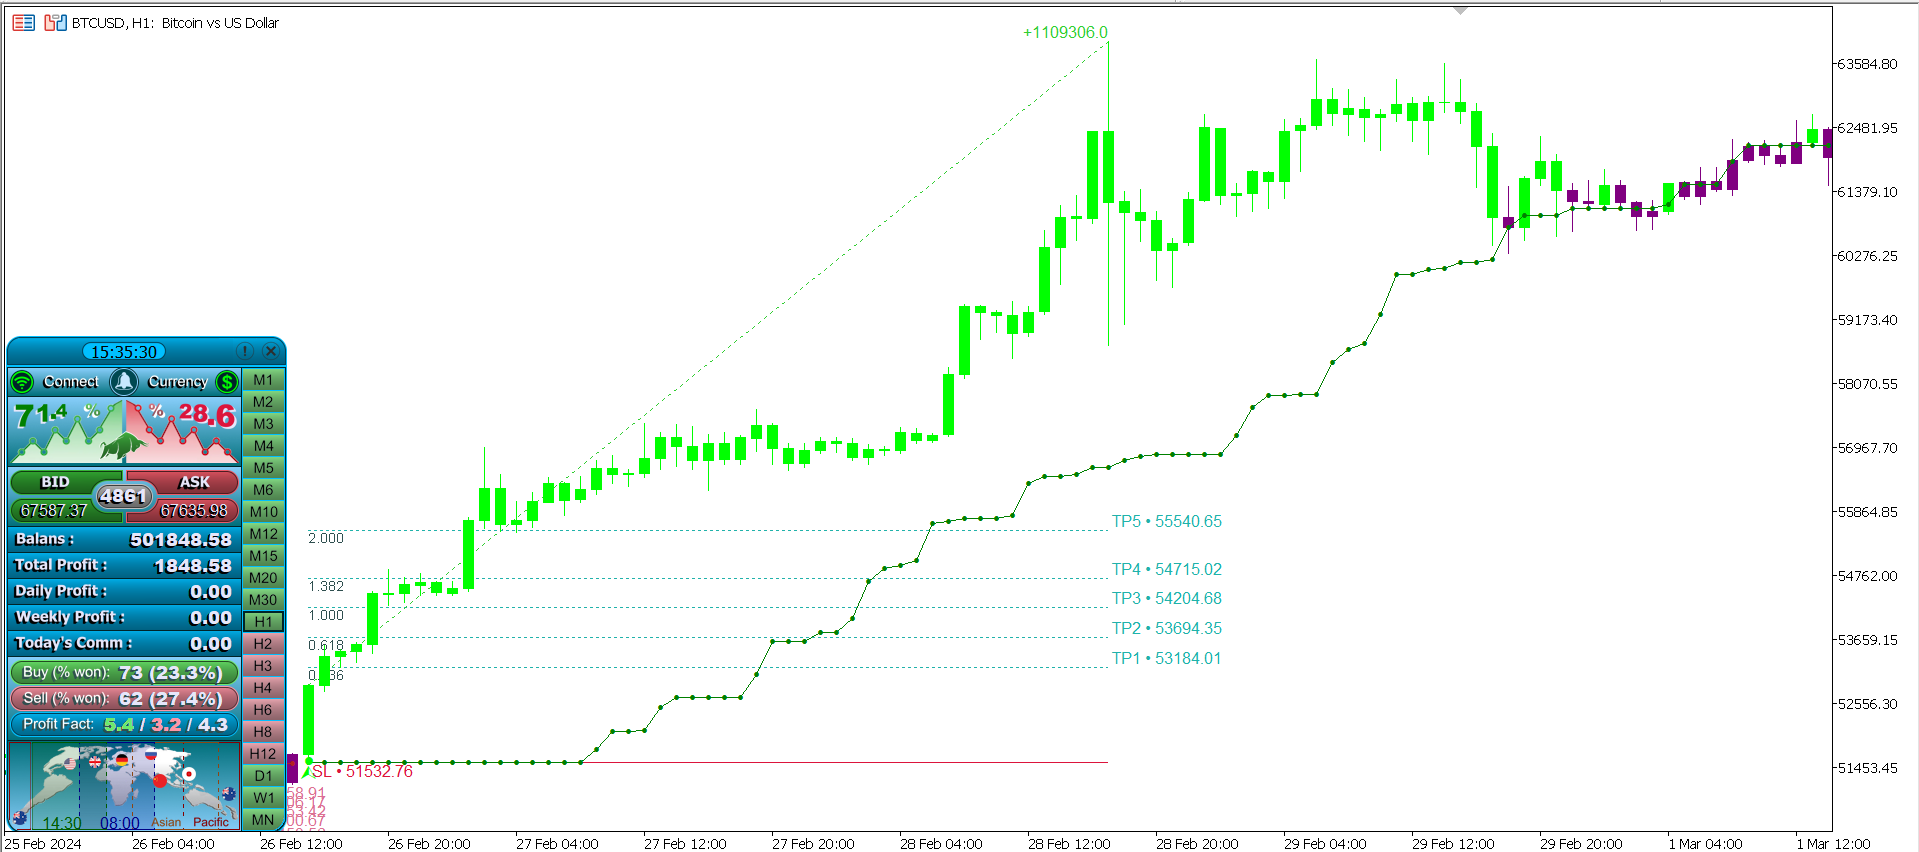
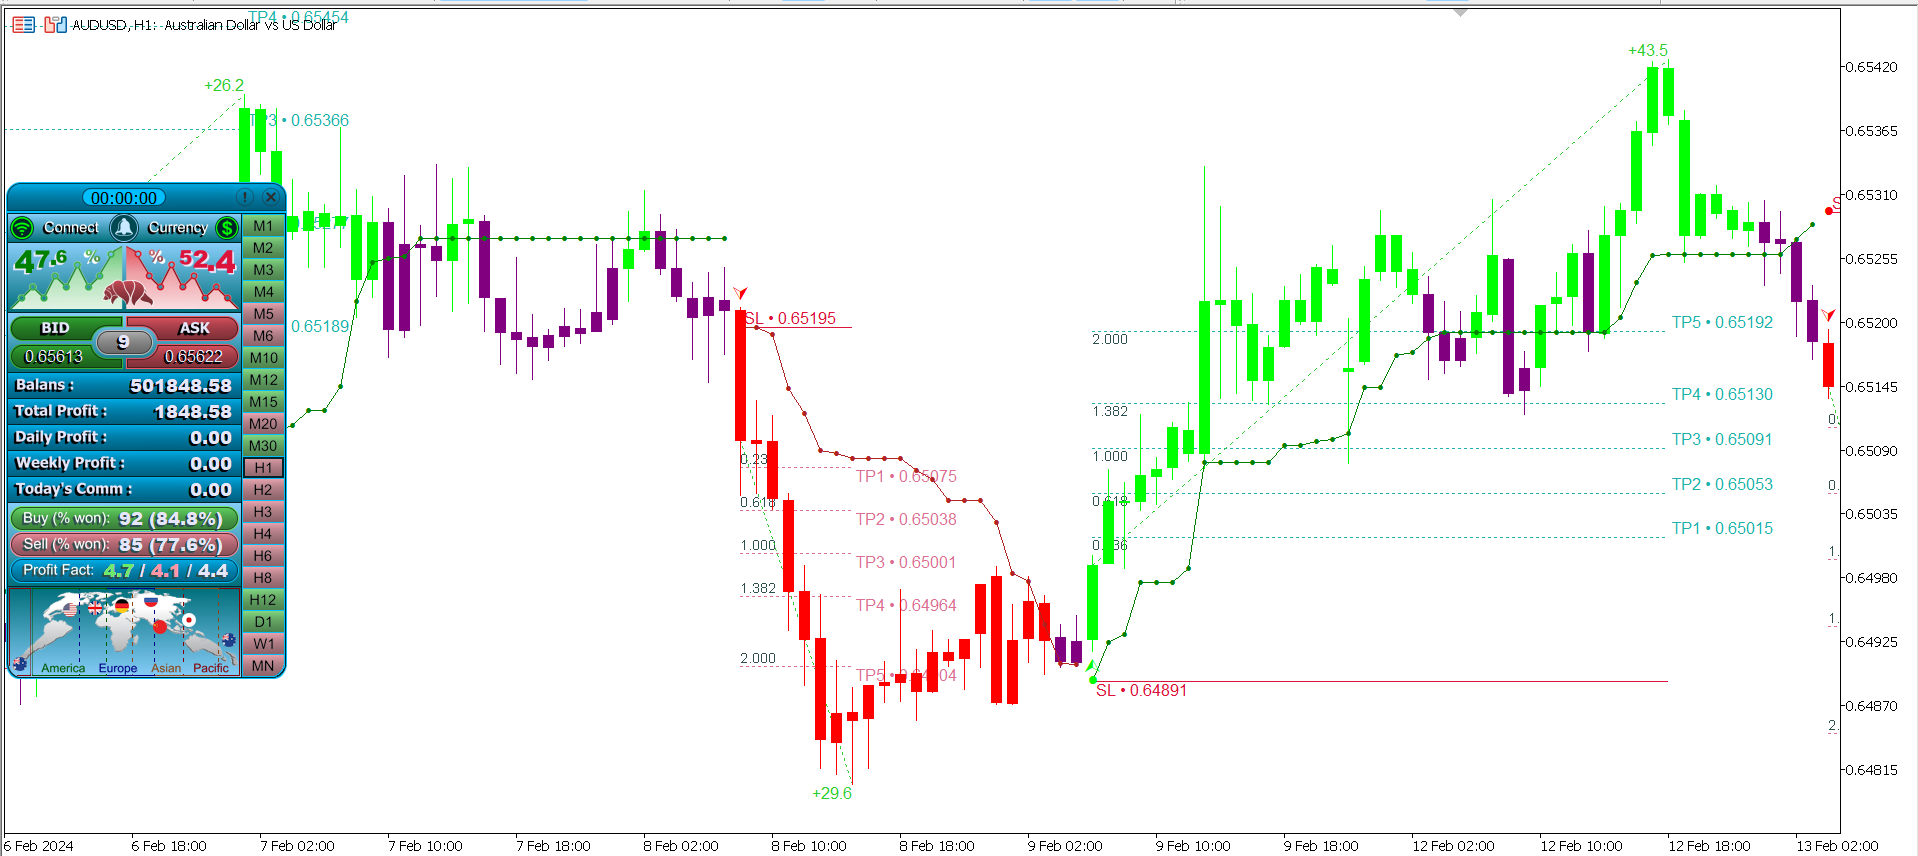
- In this approach its recommended to use the panel to the trader advantage, by looking at the win ratio and the trend scanner, the trader can use these two good info for extra confirmation on the trade, an example of that lets say the trader got a buy entry signal, then the trader should take a look at the win ratio of the overall buy signals and if the ratio is above 70% thats a good sign, also the trader can use the MTF trend scanner to gage the overall trend direction, if the majority of TFs are green which means bullish the % of the bullish trend will be higher and thats a 2nd good sign. Now using these two signs to our advantage, this can help us trade better.
So we got an uptrend over the majority of TFs and we got a good win ratio of buy trades, Now we can take the trade with extra confirmation and confidence, Its highly recommended to put hard SL in the SL level shown by the indicator, because its well tested even if it get hit "Its part of the game move on and find another trade". And in the same way Its highly recommended to use the TP levels, for the TP levels. There are two way to go about the take profit placement. The 1st one is using the TP5 only and put the take profit level right at the price of the TP5 and this will give you a 1:2 RRR. And the 2nd way is to use TP3 and TP5, in this case TP3 is 1:1 RRR and right there you can take half of the profit and move SL to BE, and when the price reaches the TP5 which is again 1:2 RRR the trade will close with what's left of the Lot size used initially. Note: You have to be good at money management and always use the golden rule of 1% per trade, for one reason lets hypostatically imagine a strategy that works 99% of the time, you thinking that its works 100%-1% is complete mistake cuz if you take one trade and you risked 100 % of your balance on that trade and happen to be part of the 1% loss ratio you will loose all, then its your fault and you should be blamed for that, SO take it easy and built the house stone by stone. 1% by 1%.
2. Passive trading (by executing the trading signals when available):
Lets dive into this second approach, this typically wont have the advantages of the first approach cuz we wont be using the win ratio and the trend screener on the panel:
- In this method of trading, the trader will install the indicator on the desired charts on the VPS and preferably remove the panel completely from the chart for better performance of the indicator on the weak VPS CPU, by attaching the indicator to the chats traders will receive signals consistently and in the alert signal they will receive the entry point and SL level as well TP1 and TP2, "the TP levels on the alert are only defining the tp1=1:1 RR and TP2=1:2 RRR", as far as taking these trades come, its will be very similar to the 1st approach, risk 1% of your balance and set hard SL at the SL price provided in the alert and choose either taking all the profit at TP2 or taking half at TP1 and move SL to BE and take the rest at TP2.
- Currencies and Pairs: EURUSD, AUDUSD, XAUUSD...
- Timeframe: H1.
- Accounts type: Any ECN, Low spread account.


-
Rent a VPS: First, you need to rent a Virtual Private Server (VPS) where you'll host your MT5 terminal and the indicator. There are various VPS providers available; you can choose one that suits your requirements and budget.
-
Install MT5 on VPS: Once you have the VPS, install the MetaTrader 5 terminal on it. You can download the MT5 installation file from the MetaQuotes website and follow the installation instructions.
-
Install the Atomic Analyst on the VPS MT5: Install the AA on the VPS.
-
Launch MT5 on VPS: Open the MetaTrader 5 terminal on your VPS. Log in with your account credentials.
-
Attach the Atomic Analyst to a Chart: In the MT5 terminal on the VPS, open a chart for the symbol you want to trade. Drag and drop the atomic analyst onto the chart. keep the default settings for better performance.
-
Enable Push Notifications: In the settings inputs make sure that the alerts are set to true so the atomic analyst will send alerts.
-
Configure MT5 Phone App: Install the MetaTrader 5 app on your phone from the respective app store. Log in with the same account credentials used on your VPS.
-
Enable Push Notifications on Phone App: In the MetaTrader 5 app settings on your phone, ensure that push notifications are enabled.
-
Test the Setup: Once everything is set up, test the configuration by triggering a signal on your MT5. You should receive a push notification on your phone via the MetaTrader 5 app, with the entry price SL and TP1 and TP2 prices.
-
Monitor Signals: Now, you can leave the MT5 terminal running on your VPS. Whenever the atomic analyst generates a buy or sell signal, you'll receive a push notification on your phone.
-
Place Trades: When you receive a notification, you can open the MetaTrader 5 app on your phone, analyze the signal further if needed, and place trades through the app or via your laptop terminal.


Lets go thro the settings of the atomic analyst and explain each and everyone of them:
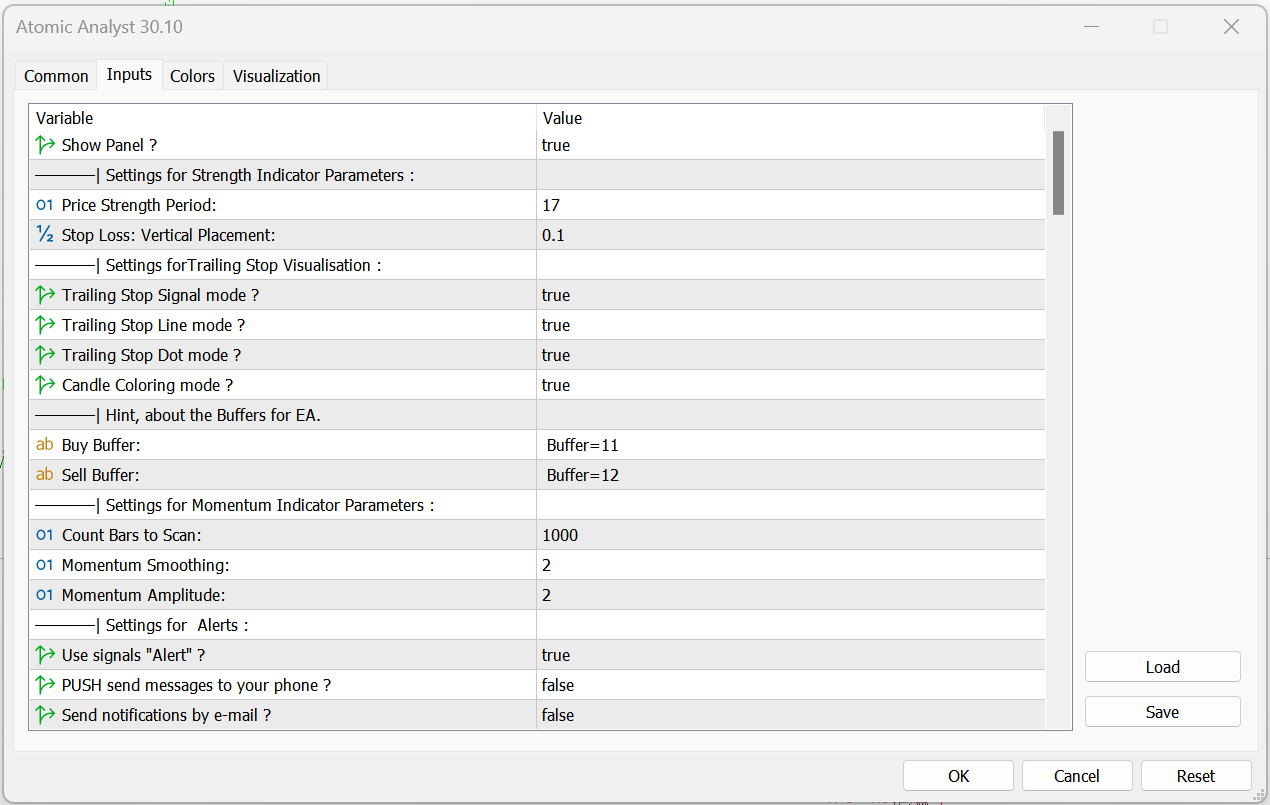
- Show or hide the panel: This tab if set to false will remove the panel completely from the chart but will keep the indicator running smoothly and you will be able to receive notifications.
- Settings of the Strength Indicator:
- Price Strength: The strength period is the factor responsible for the display of the bullish and bearish price move or green and red impulse, when you change is the strength of the impulse will also change.
- SL vertical placement: The SL placement will be changed as you change this factor between a tight SL and a large wiggly SL.
- Trailing Stop Visual: Choose to hide the Elements of the trailing stop including the line dots and signal. Note Pls dont hide the signal its important.
- Buffers for EA: This indicator can be used with EA that support buffers entries and you can use 11 for buy and 12 for sell.
- Setting for momentum indicator:
- Bars to scan: defaulted to 1000, this will dictate how many bars the indicator will use to analyze data this data will be used to calculate win ratio and also good for visual purposes. Note: pls keep the bar count low for better CPU performance.
- Smoothening and amplitude of the momentum calculation, lower numbers will give you earlier entries but many entries and higher numbers will give you bit late entries but less entries, the smoothening and amplitude factors are very important for the calculation of the momentum of the trend and size of the impulse.
- Alerts of the indicator signal: by default on the mt5 terminal alerts are turned on, to receive phone notification and Emails you have to turn both to true. also make sure that you have set up the mt5 properly to send push notifications to your phone.
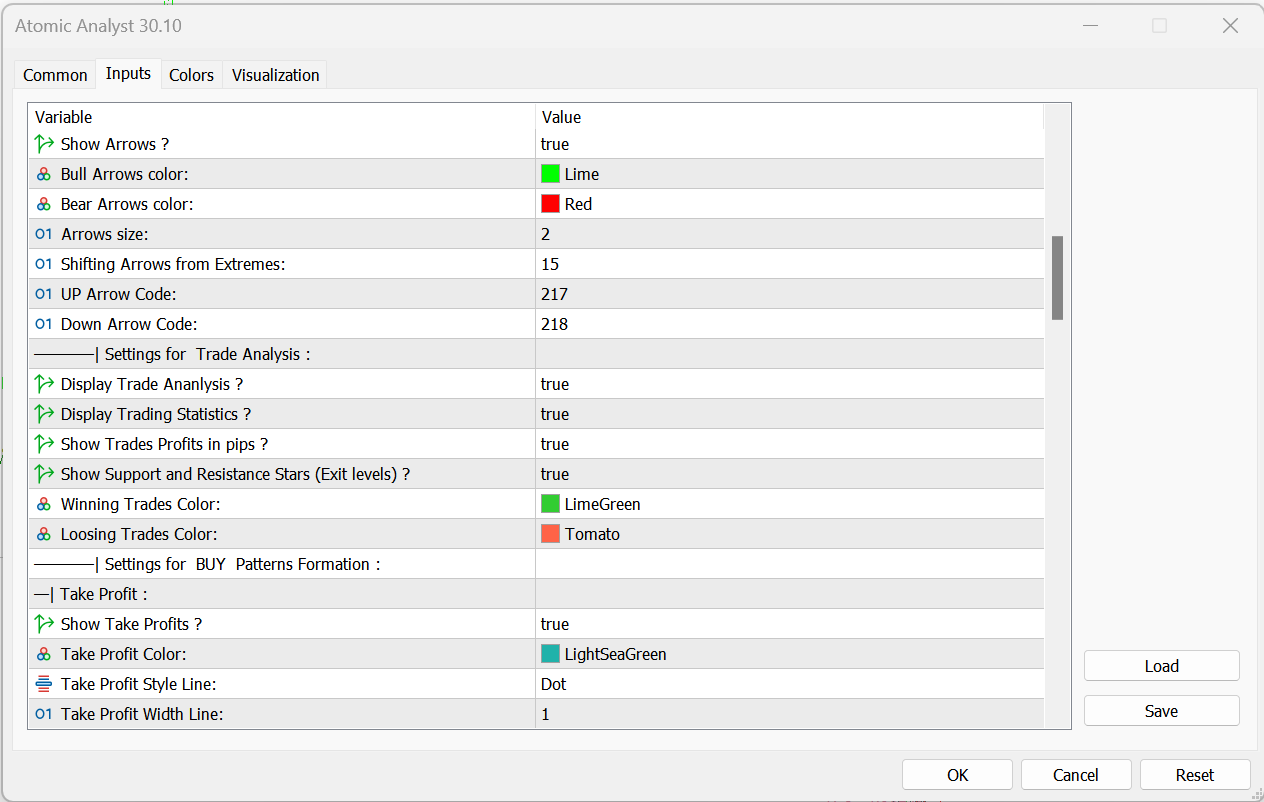
- Settings for the Arrows: You can control to show the arrow signal or hide them and control which color the buy and sell arrows you prefer to have, and also increase the size of the arrows, the shift of the arrows will move the arrows up or down closer or farther from the signal candle, lastly you can choose to change the type of the arrow buy changing the code you can find the arrows types by googling the list.
- Settings for the trade analysis: These settings will allow you to show or hide the pip counter and all the elements that comes with it and also will allow you to change the colors of those elements.
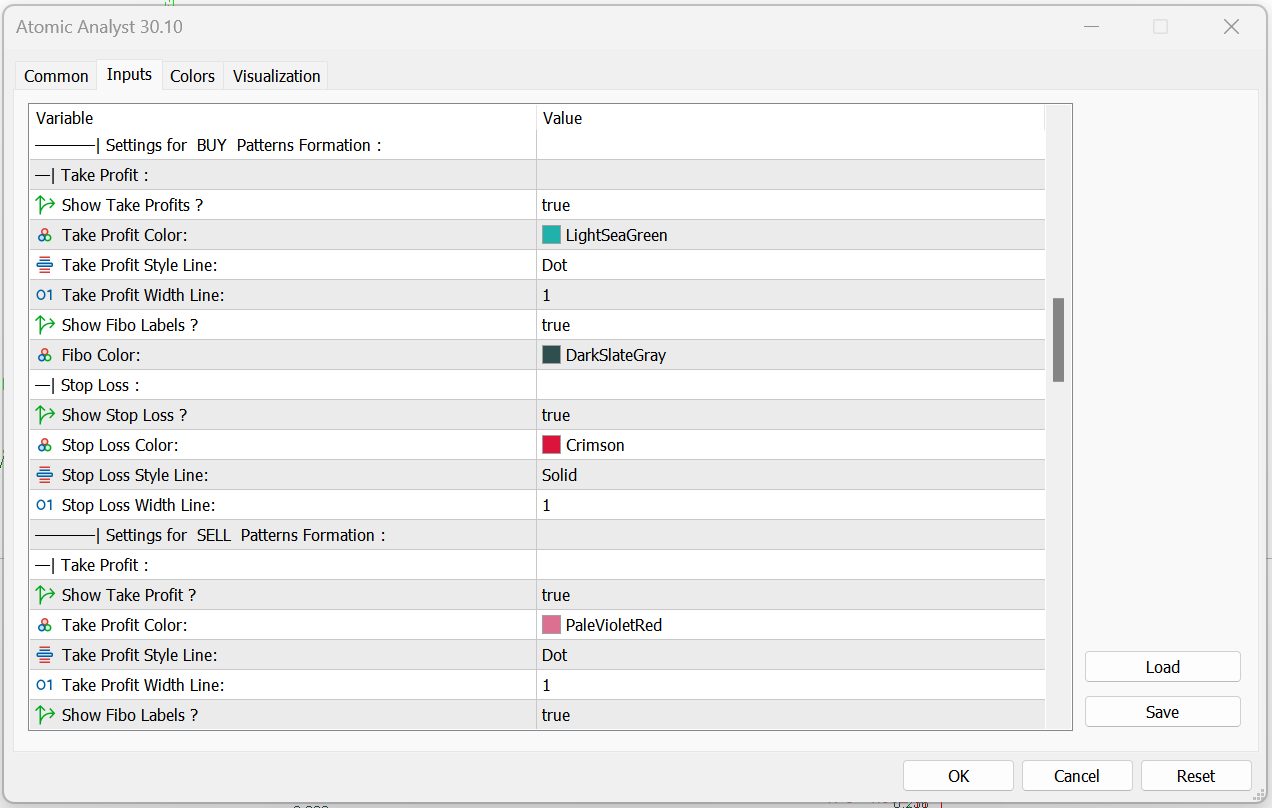
- Settings for buy and sell pattern formation: these settings will allow you to control the colors sizes and wither to show of hide the elements of the buy and sell set up like the SL line and the entry line and also the TP lines which are based on fibo levels. you can control how you want each to look individually.
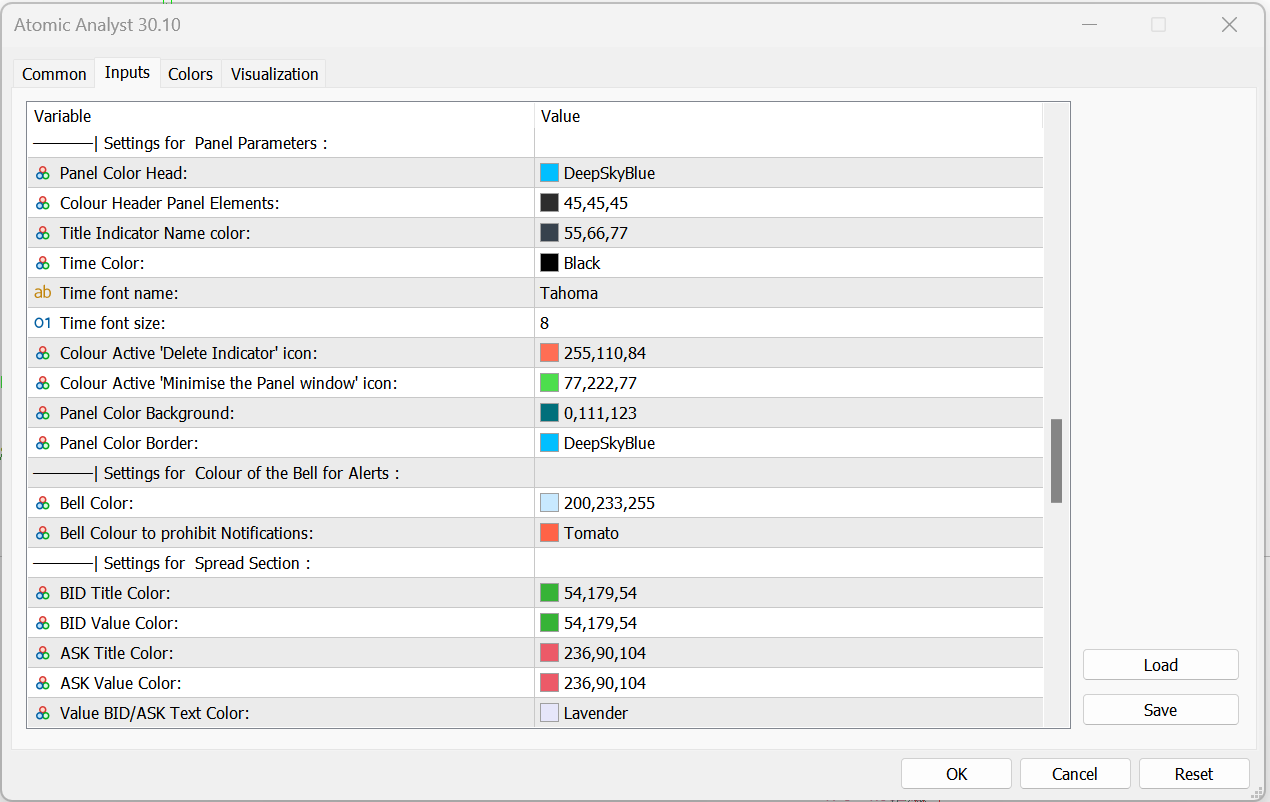
- The panel appearance settings: These settings will help you customize the look of the panel in the way you like. keep in mind that the default settings and choice of colors was made to look good on any background color, so you might not need to change any of these settings.
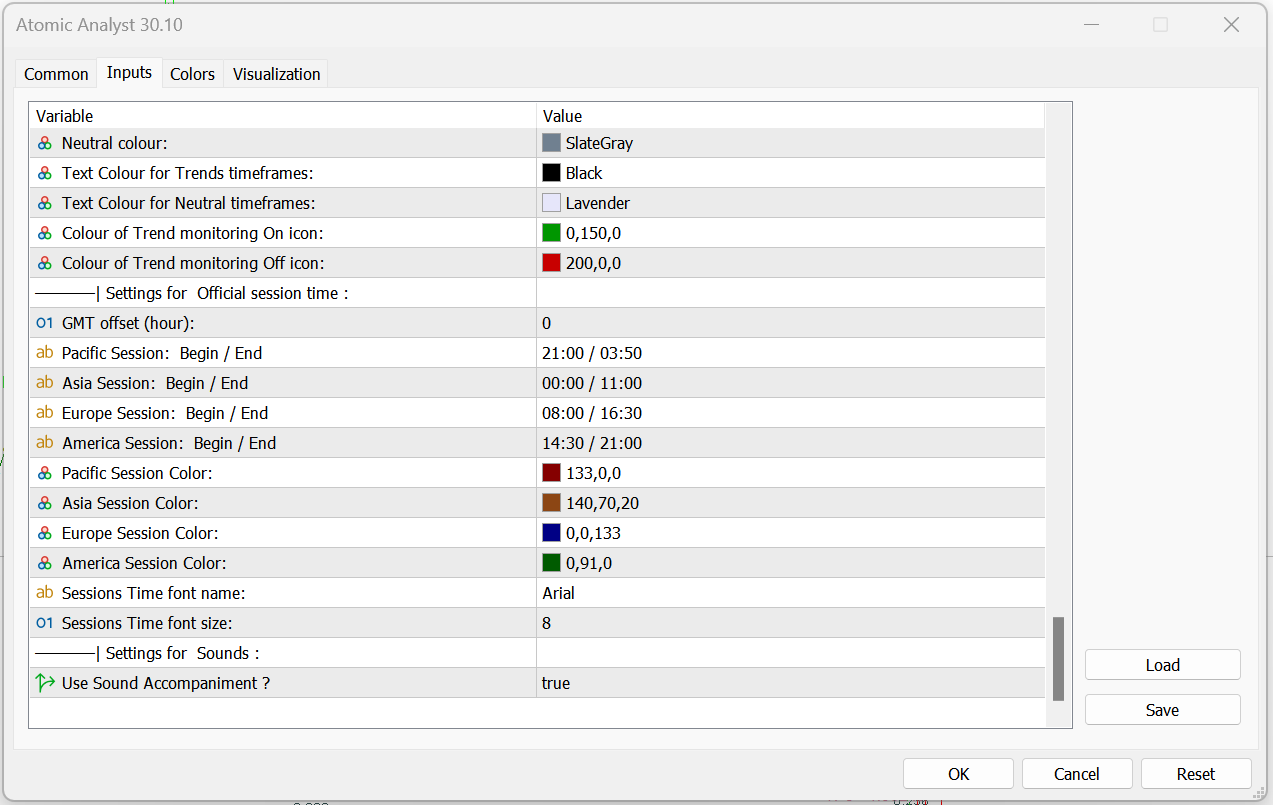
- Settings for the session time:
- GMT offset: this depends on your broker time zone will set up the time correctly.
- All trading session start/end time inputs.
- Control the session color and the session txt name color and size.