
Against the backdrop
of weak macro data, the Australian dollar continues to decline. At the moment
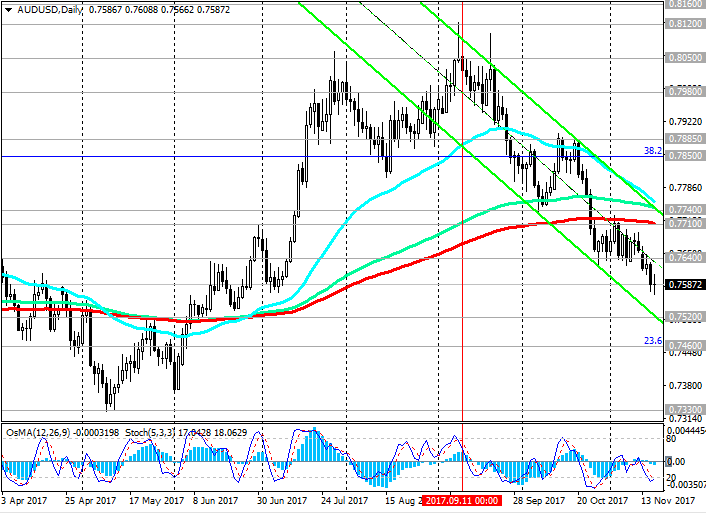
there are no positive factors that can spur its growth.Since September, AUD /
USD is trading in a downward channel on the daily chart, the lower limit of
which is near the support level of 0.7520 (December 2016 highs).
The negative dynamics prevails, and AUD / USD is
trading below the key resistance levels 0.7710 (EMA200 on the daily chart),
0.7740 (EMA144 and the top line of the downward channel on the daily
chart).
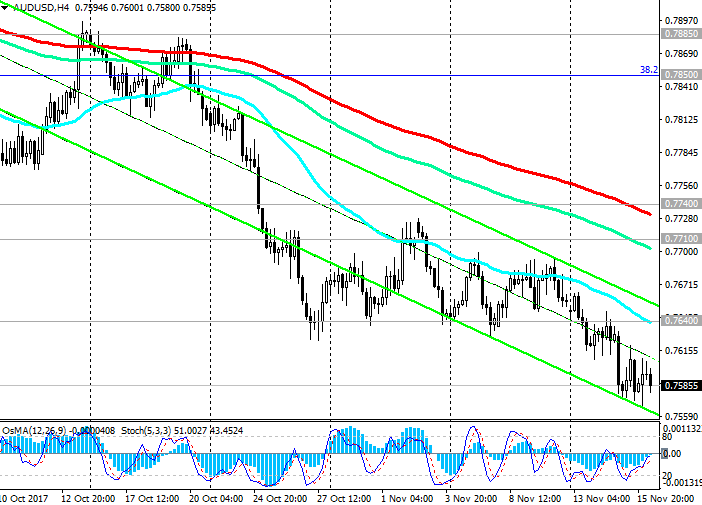
Indicators OsMA and Stochastics on the 4-hour,
daily, weekly and monthly charts are on the side of sellers.
In the event of further decline, the targets
will be support levels of 0.7520, 0.7460 (Fibonacci level of 23.6% correction
to the wave of decline of the pair since July 2014, the minimum of the wave is
near 0.6830). The breakdown of the support level of 0.7460 will return the AUD
/ USD pair into a global downtrend that began in July 2014.
You can start the medium-term long positions
only after AUD / USD returns to the zone above the resistance level 0.7740
(EMA144 and the top line of the descending channel on the daily chart). The
growth targets in this case will be the levels of 0.7850 (Fibonacci level
38.2%), 0.7885 (October highs), 0.7980 (EMA200 on the weekly chart). The first
signal to consider long positions will be a breakdown of the short-term
resistance level of 0.7640 (EMA200 on the 1-hour chart, October lows).
Support levels: 0.7520, 0.7500, 0.7460
Resistance levels: 0.7640, 0.7710, 0.7740, 0.7800, 0.7850, 0.7885, 0.7980
Trading scenarios
Sell по-рынку. Stop-Loss 0.7615. Take-Profit 0.7560,
0.7520, 0.7500, 0.7460
Buy Stop 0.7615. Stop-Loss 0.7570. Take-Profit
0.7640, 0.7710, 0.7740, 0.7800, 0.7850, 0.7885, 0.7980
Author signals - https://www.mql5.com/en/signals/author/edayprofit


