Crude Oil tested the rising trend line as seen on Daily Chart .
Price is above the FIBO retracement .
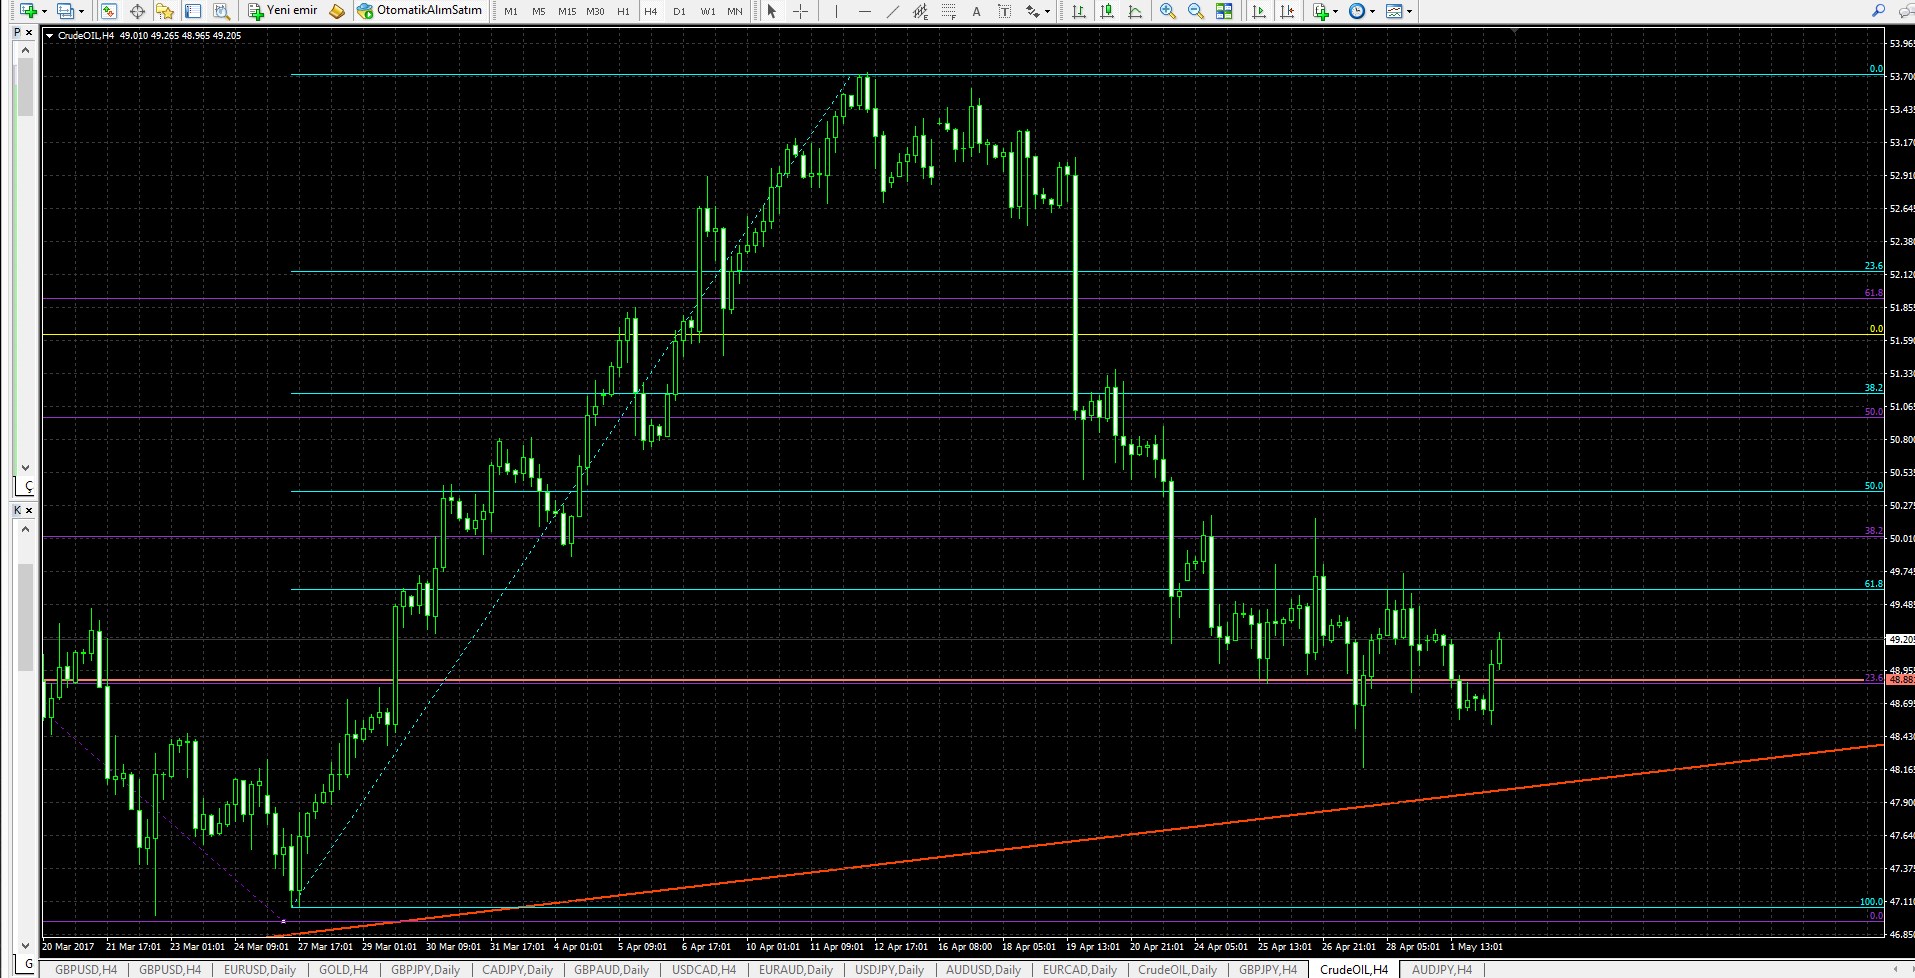
As seen on H4 chart with FIBO the next level is 49.50. Then 50 and 50.30 short term.
On H4 chart with murrey math lines and MA s , price is above ma 12 , 20 and MA 50 resistance is @49.50
You can view the details :
https://www.fxters.com/single-post/2017/05/02/WTI-Crude-Oil-Tested-The-Trend-Line
Good Luck
Files:
wtih4fibo.jpg
484 kb


