

H4 price is on ranging market condition waiting for direction: the price is traded between 100 period SMA and 200 period SMA for trying to cross 100 SMA or 200 SMA from below to above and from above to below for the bearish or bullish trend to be continuing.
- "The Australian Dollar continues to consolidate below the 0.73 figure against its US counterpart having broken support set from early November. Overall positioning may be carving out a bearish Head and Shoulders topping pattern, although confirmation is still pending for now."
- "From here, a daily close below resistance-turned-support at 0.7184 opens
the door for a challenge of 0.7089, the intersection of a rising trend
line set from September lows and the 23.6% Fibonacci expansion.
Alternatively, a push above horizontal pivot resistance at 0.7283 paves
the way for a test of the 38.2% Fib retracement at 0.7387."
-
"We sold AUD/USD at 0.7250 and subsequently booked profit on half of the position."
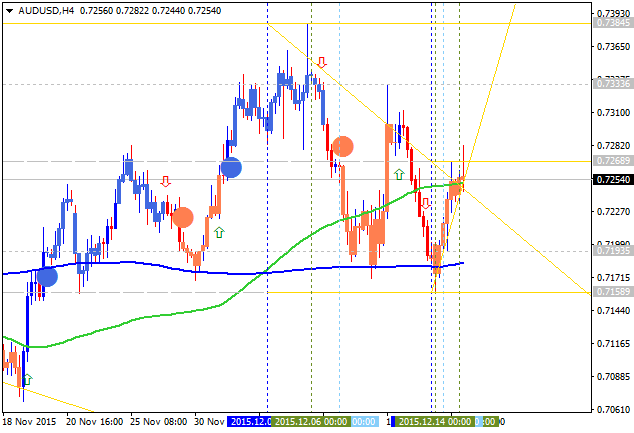
Anyway, H4 price is located near 100 period SMA on the border between the primary bullish and the ranging bearish trend on the chart with the symmetric triangle pattern to be crossed for direction:
- if the price breaks 0.7268 resistance so the reversal to the primary bullsh condition will be started;
- if the price breaks 0.7158 support level so the primary bearish trend will be continuing with the secondary ranging up to the new 'bottom' to be forming;
- if not so the price will be moved within the channel.
| Resistance | Support |
|---|---|
| 0.7268 | 0.7158 |
| 0.7384 | N/A |


