
USD/JPY Daily Technicals: near 200 day SMA on reversal area waiting for direction
10 December 2015, 13:11

0
7 920
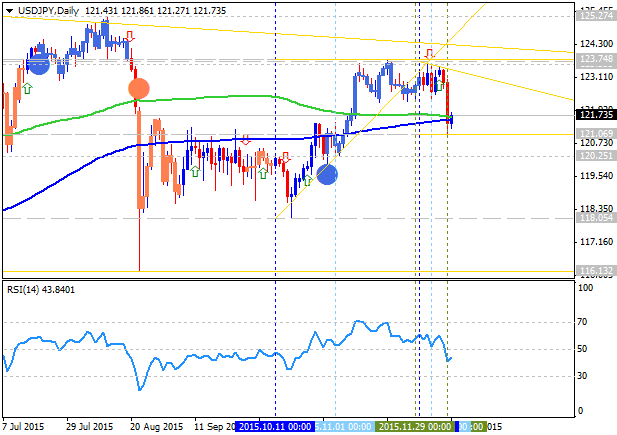
D1 price is near 100 day SMA (100 SMA) and 200 day SMA (200 SMA) waiting for daily bearish/bullish direction of the trend. The key support/resistance levels for this pair are the following:
- 121.06 support level located below 100 SMA/200 SMA in the beginning of the bearish area of the daily chart, and
- 123.78 resistance level located above 100 SMA/200 SMA in the bullish area of the chart.
RSI indicator is estimating the ranging bearish condition.
- If the price will break 123.78 resistance level so the bullish trend will be continuing.
- If price will break 121.06 support so the bearish reversal will be started.
- If not so the price will be ranging within the levels.
| Resistance | Support |
|---|---|
| 123.78 | 121.06 |
| 125.27 | 116.13 |
- Recommendation to go short: watch the price to break 121.06 support level for possible sell trade
- Recommendation to go long: watch the price to break 123.78 resistance level for possible buy trade
- Trading Summary: ranging for direction
SUMMARY : ranging


